

Seller Promotional Tools Analysis
03/18/2024
What is Seller Promotion Analysis?
Seller Promotional Tools Analysis is a data analysis feature specifically for the usage of Seller Promotional Tools - Product Discount, Flash Deals, Voucher, Shipping Fee Discount, Voucher, Buy More Save More.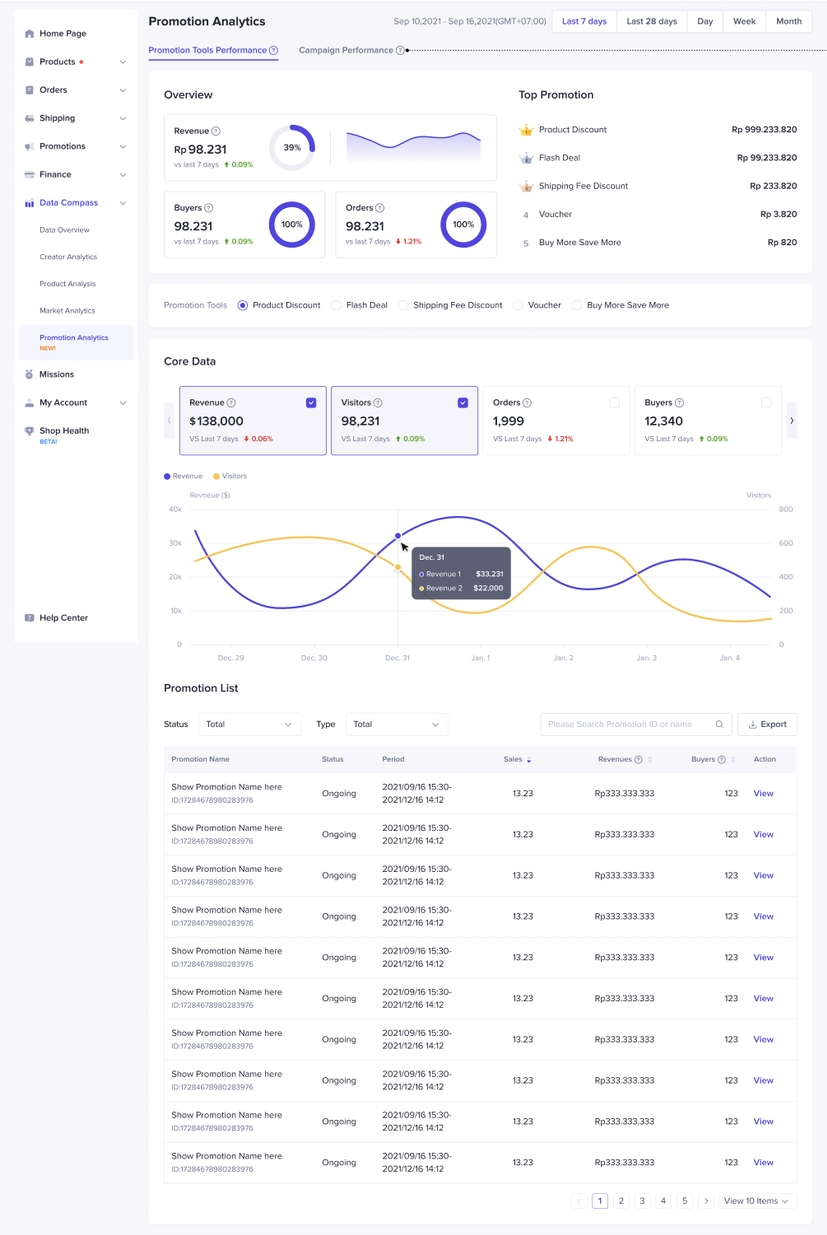 What are the benefits?
- Get a quick Overview of your top-line numbers! (Revenue, Buyers, Orders)
- Discover your best-performing Promotional Tool (based on GMV)
- Deep-dive to learn more about the Efficiency metrics (ROI, discount amount, and average price per order)
How to Check my Performance?
Entry Points from Seller Center
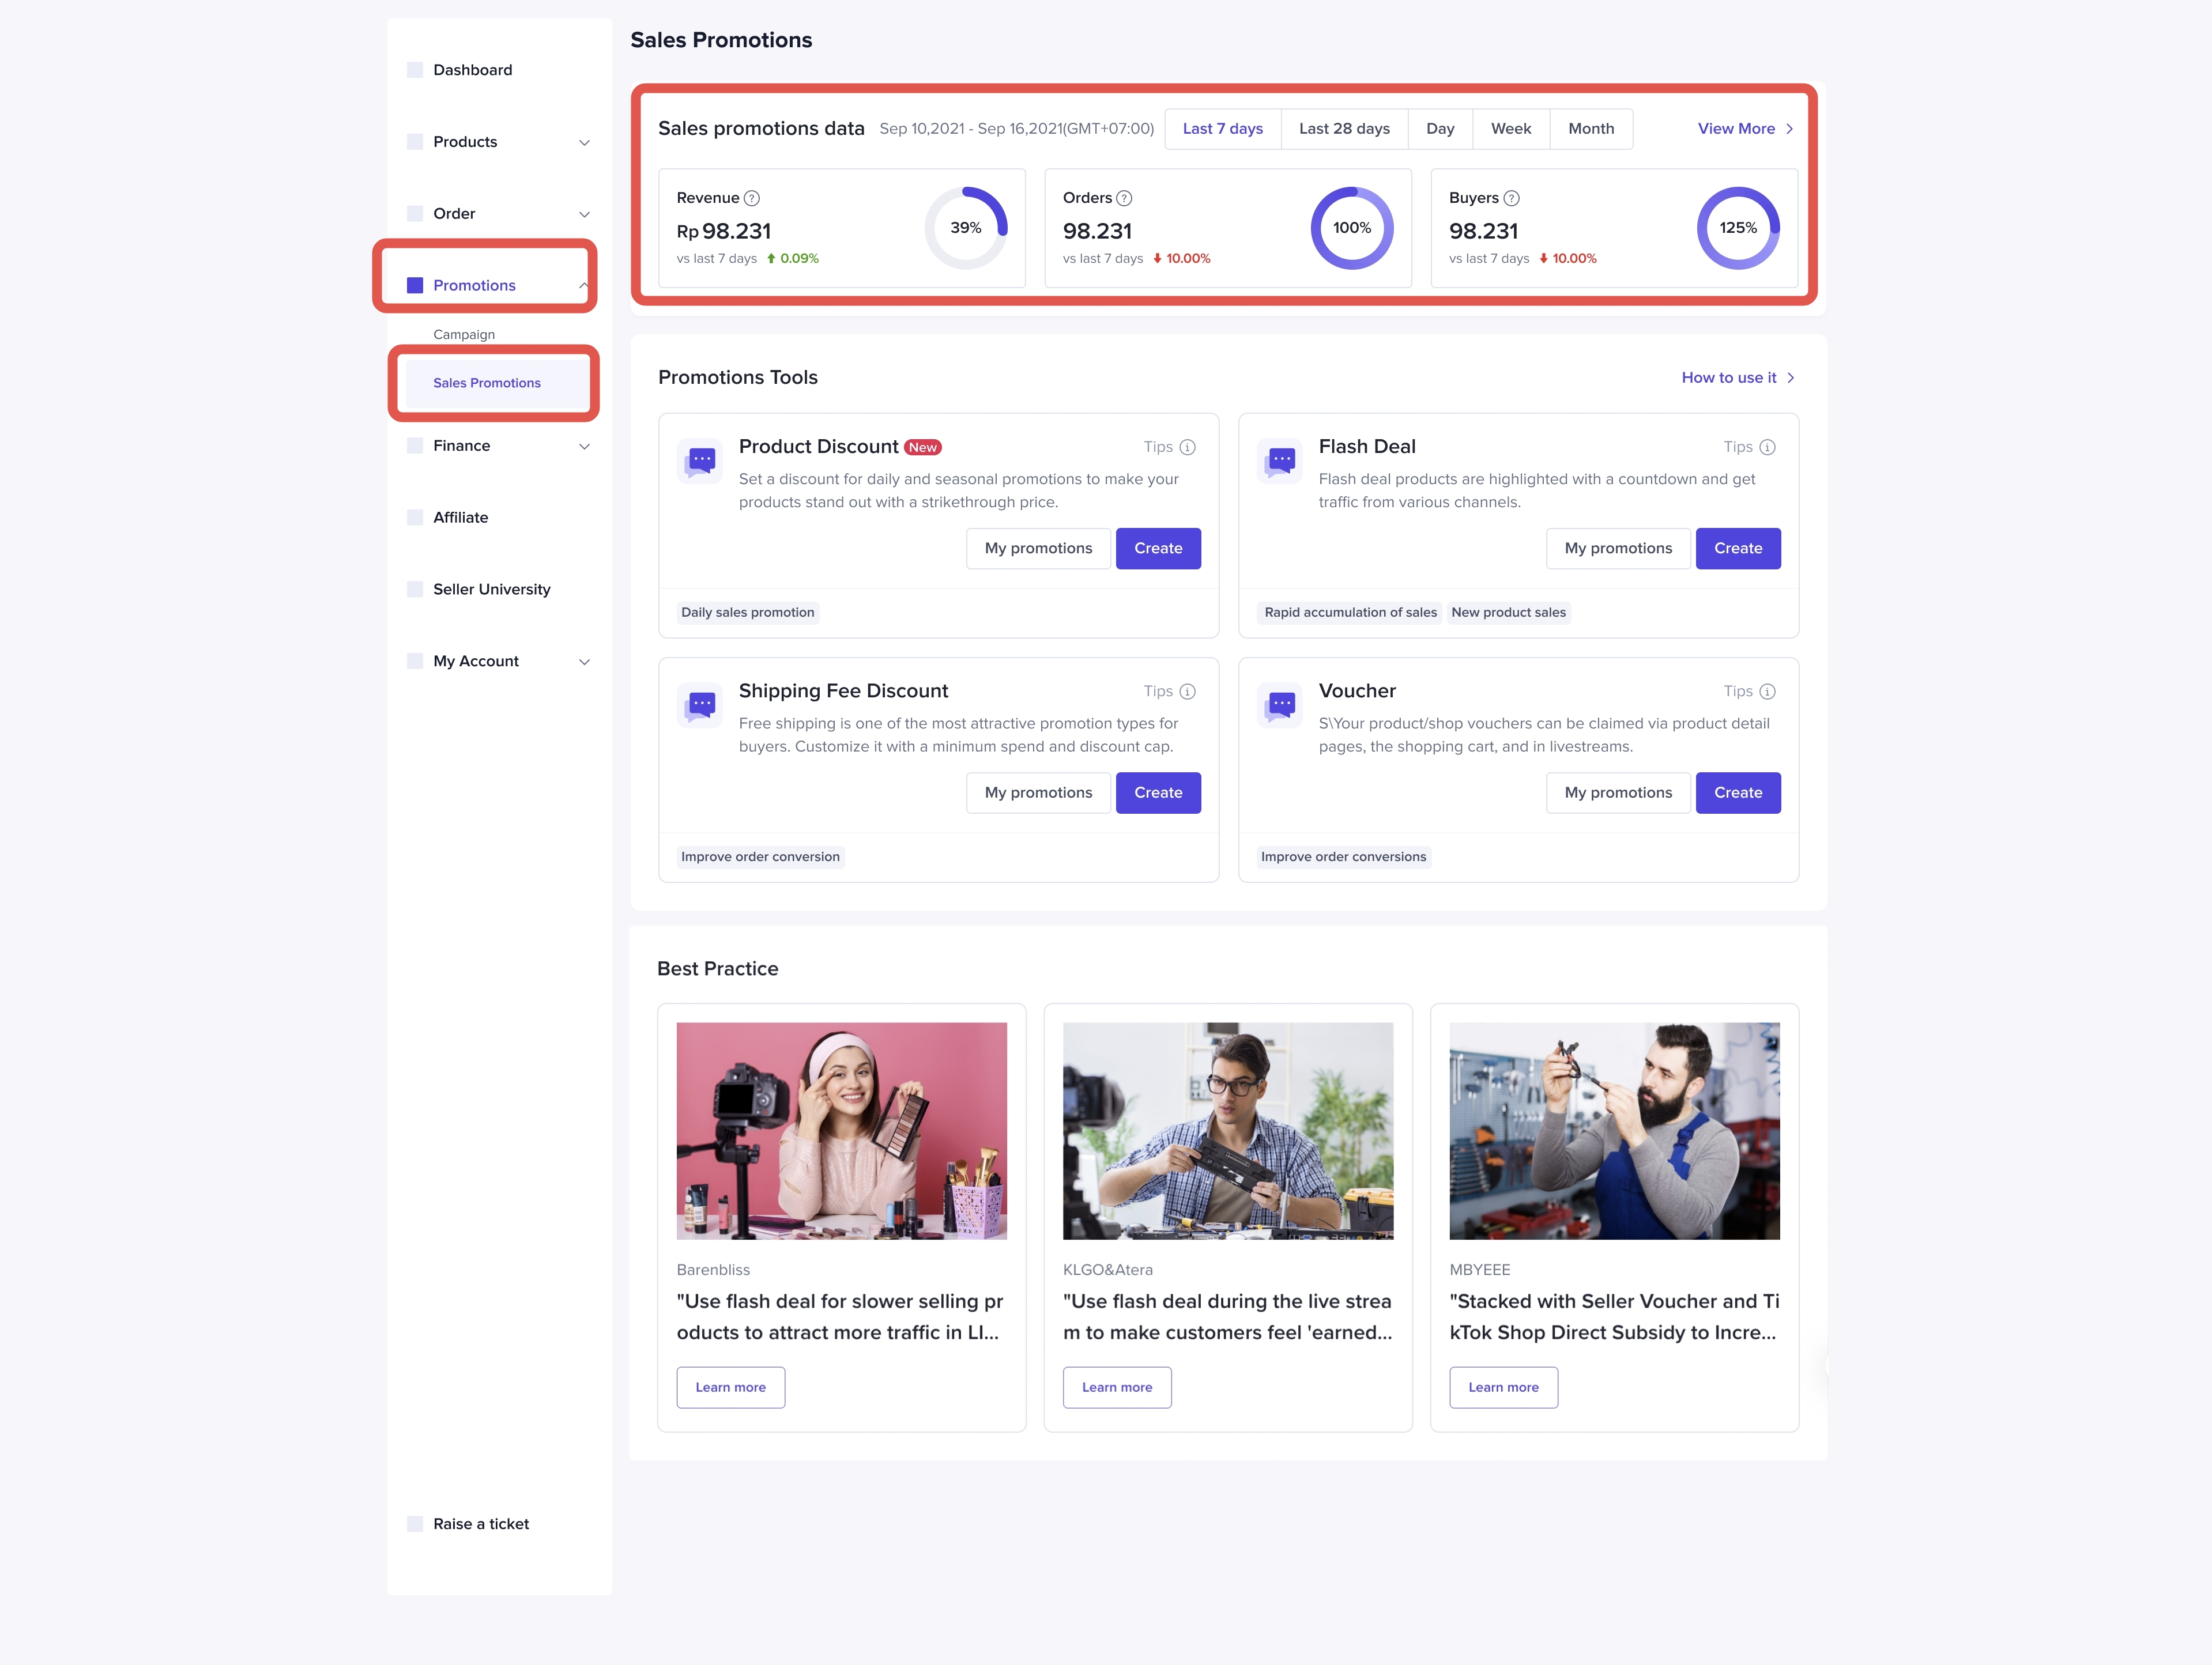
From Promotions Tab
- Promotion > Promotional Tool
- On the Promotional Tool homepage, data will be at the top of the page
- Click on 'View More' to jump into the Promotional Tool Performance on Data Compass
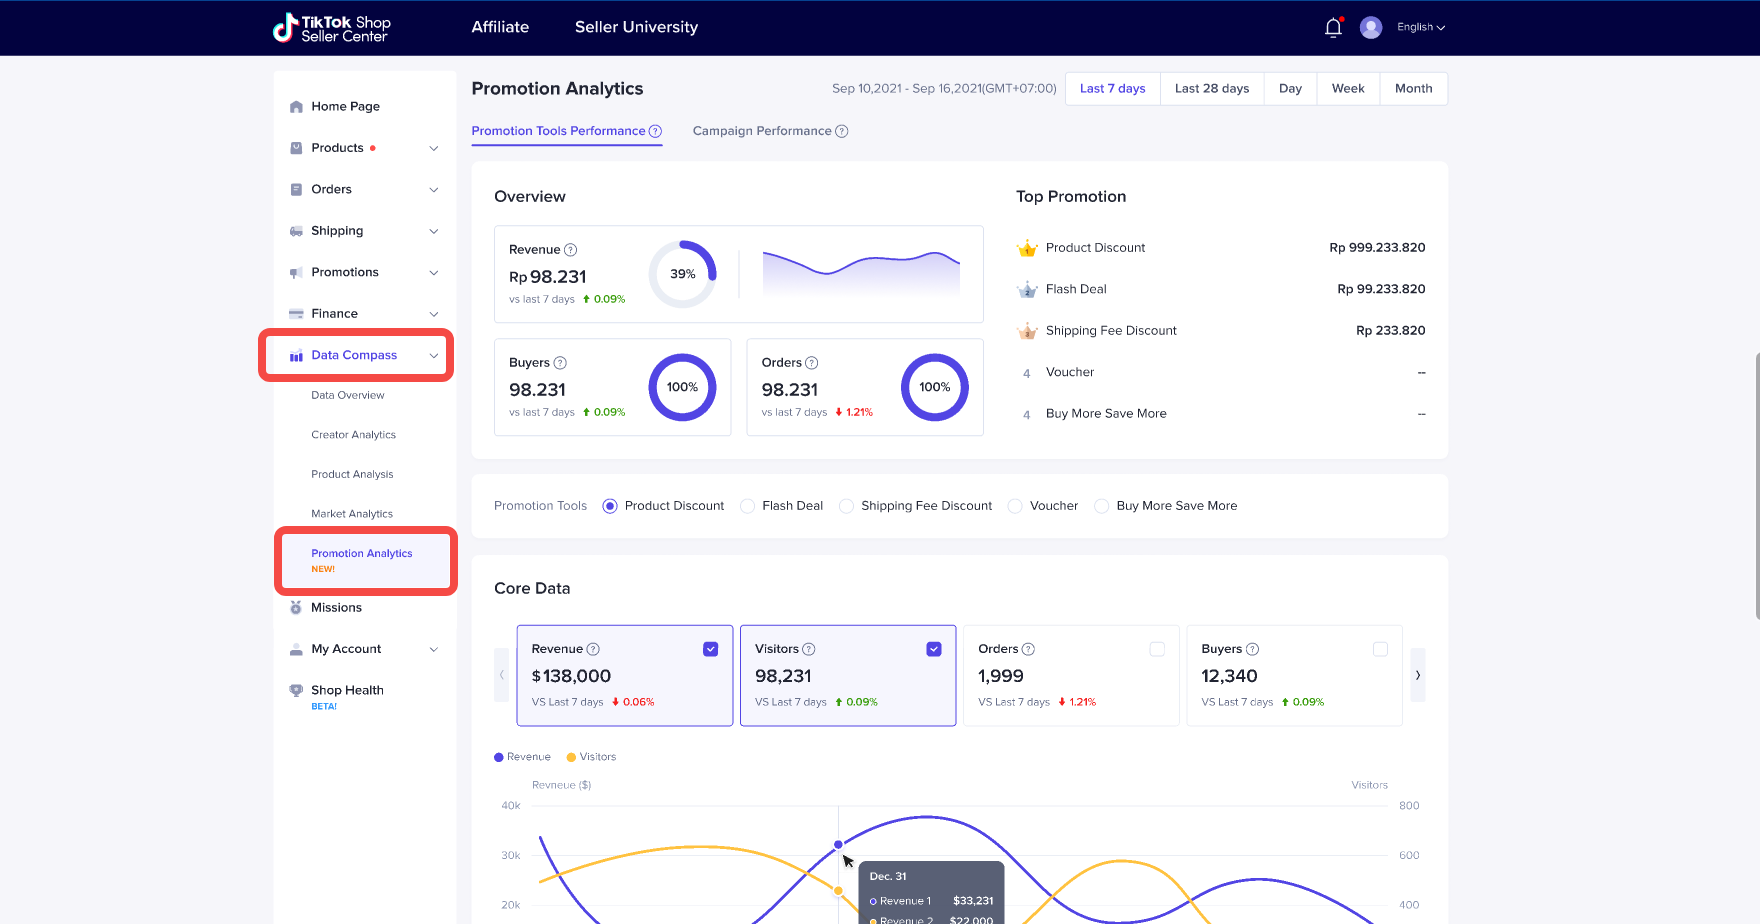
From Data Compass
- Data Compass > Promotion Analysis
- Click on Promotional Tools Performance tab
Analysis Recommendation
You may check our core features and indicators and our analysis recommendation below:- Look for the Promotional Tool that generates the most revenue for you
- Understand the discounts and revenue rates of different Promotional Tools
- Check your ROI metrics. If you find that the revenue or new buyers generated is not satisfactory, you may want to change your discount strategy with the Promotional Tools used. Determine your own healthy discount rate.
- View the ROI of different Promotional Tools to find the Promotional Tool with the highest ROI and strengthen your promotions.
- A prompt will appear if the Promotional Tool hasn't been used, resulting in no ROI at that moment
- Check the status and conversion performance of each promotion
Metrics Detail
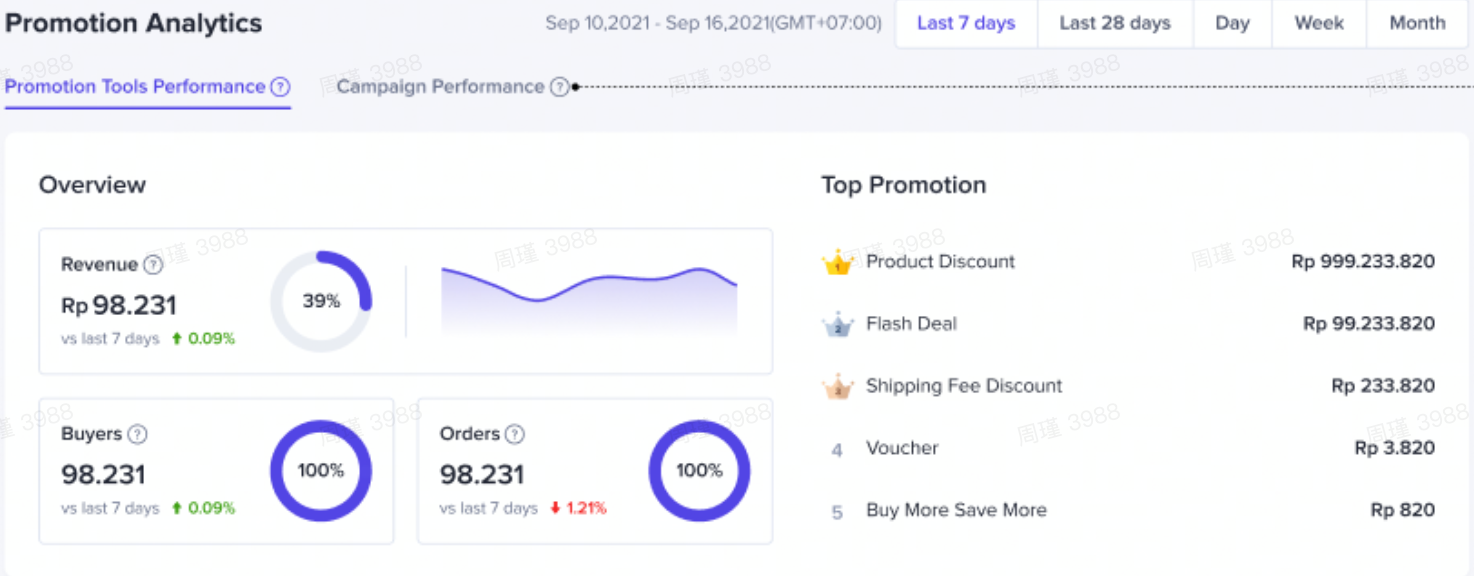
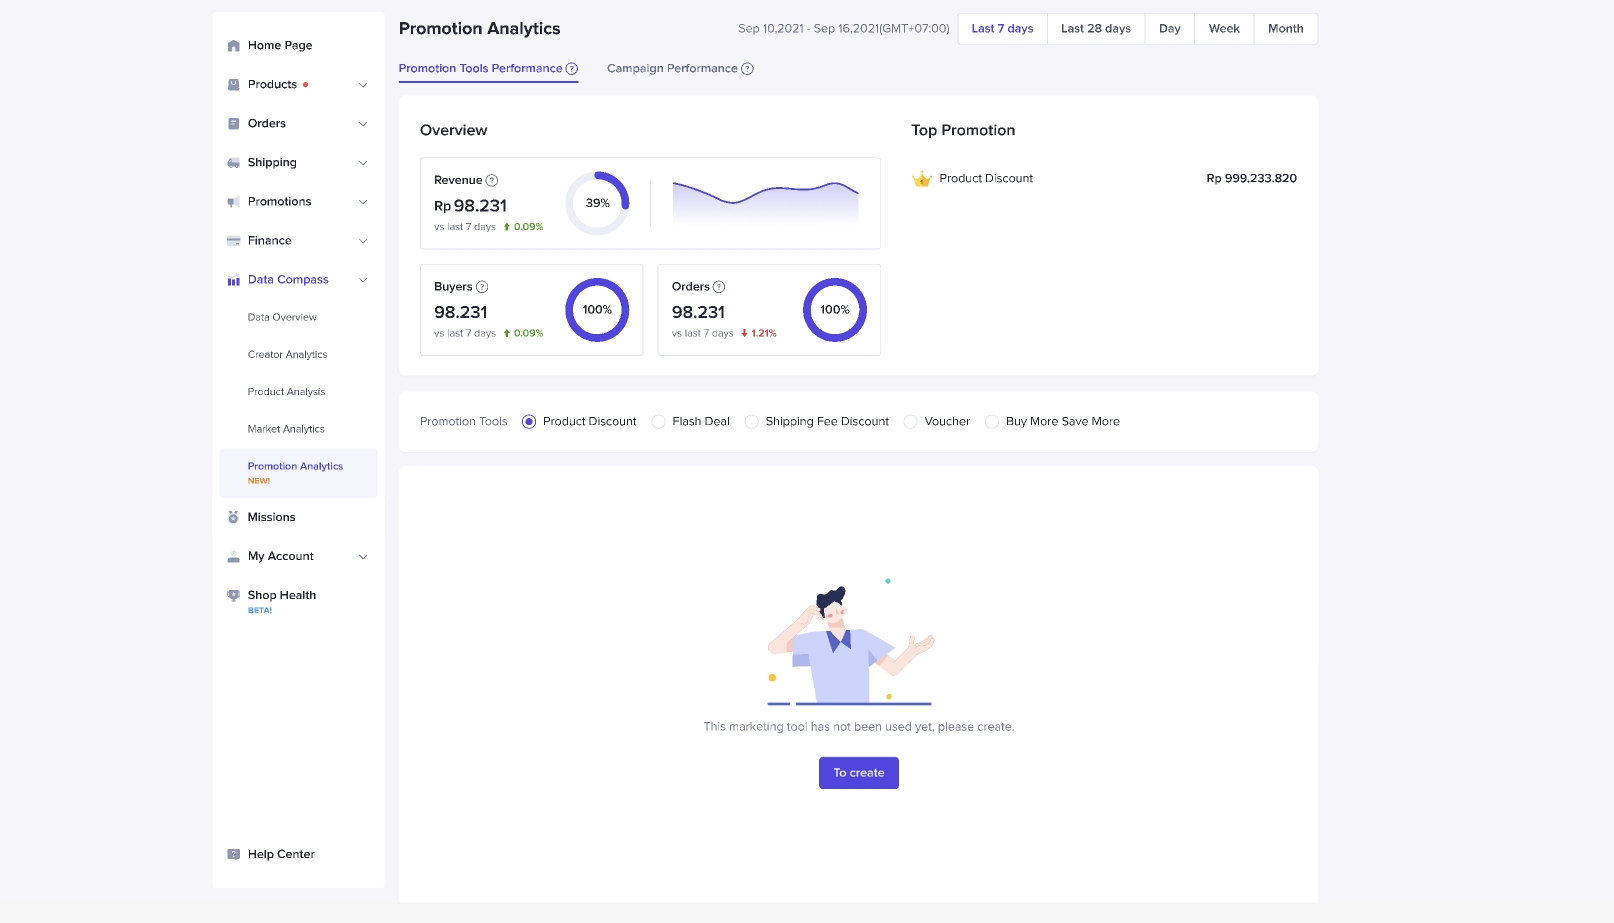
Promotional Tools Performance Overview
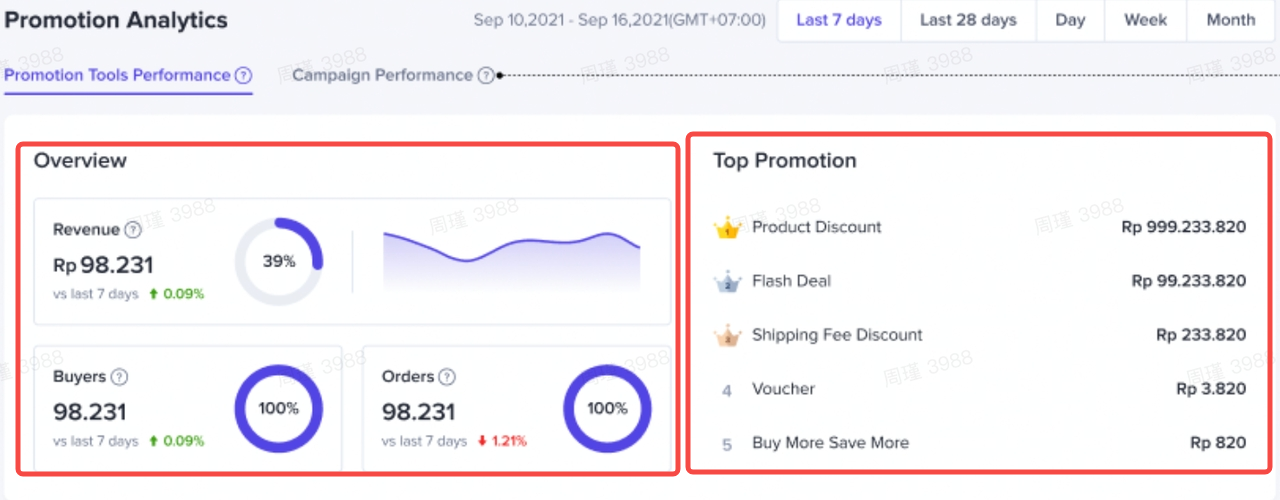
- Indicators: Revenue, Orders, Buyers
- Each indicator has a percentage to the right of it representing the revenue generated by the Promotional Tool as a percentage of the store's total revenue.
Top Promotion
 Promotional Tools such as product discounts, flash sales, coupons, shipping fee discounts and multiple discounts for multiple products are ranked based on revenue.
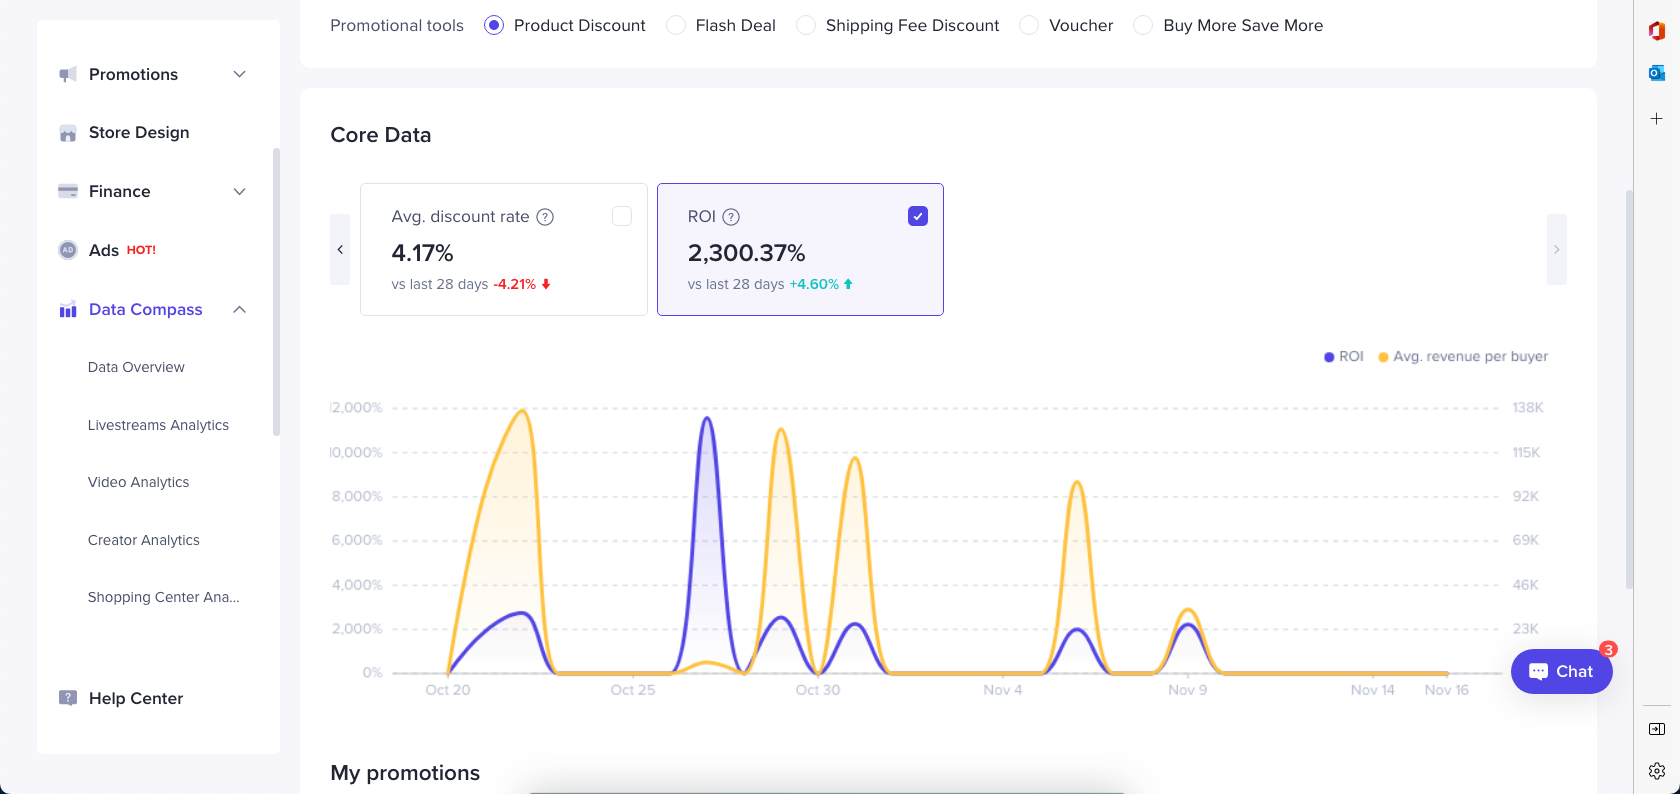
Core Data
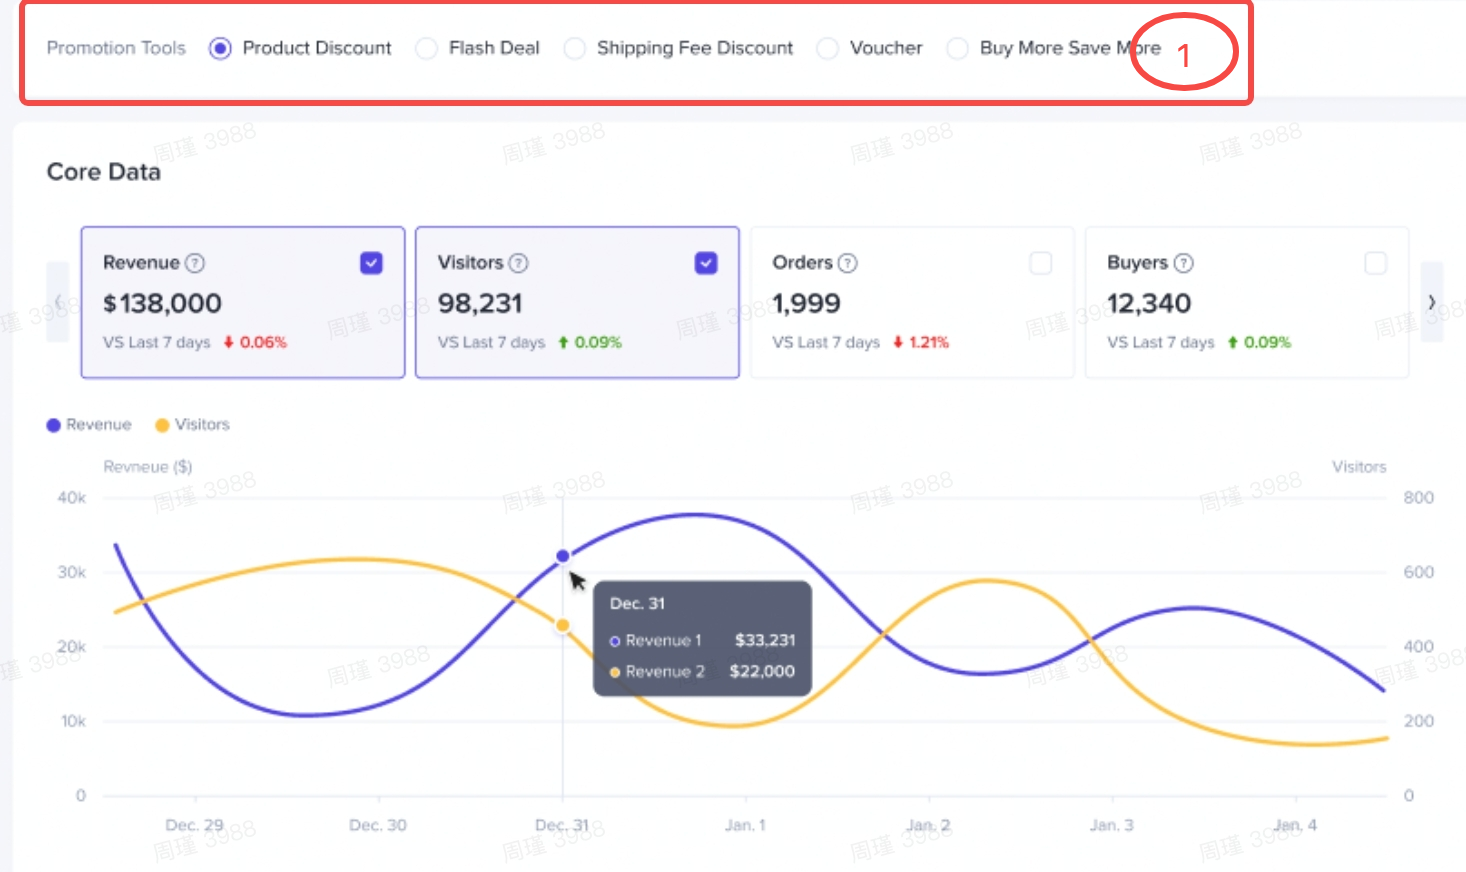 Metrics
- Revenue
- Orders
- Buyers
- Items Sold
- New Buyers
- Average Price Per Order
- Discount Amount
- Discount Rate: Discount amount/original price before discount
Promotion List
- You can select a Promotional Tool to display all created promotion events for the selected period and their performance.
- Status: An event may be in one of the four following statuses: Ongoing, Upcoming, Deactivated, and Expired
- Type: Promotion type for each Promotional Tool
- Product Discount: Fixed price and Percentage
- Shipping Fee Discount: Free and Discount
- Voucher: Regular Voucher & LIVE Interactive Voucher
- Indicators
- C_O: Conversion rate of clicks to order
- AOV: Average order value
- Revenue
- Orders
- Buyers
- Items Sold
- New Buyers
- Average Price Per Order
- Discount Amount
- Discount Rate: Discount amount/price before discount
You may also be interested in
- 1 lesson
Tokopedia PLUS
Tokopedia PLUS, now with More and Better benefits!
- 1 lesson
Promotion
Leverage promotions to attract more customers and boost sales!
- 7 lessons
Promotional Tools
Utilize vouchers, discounts, and bundling features to encourage purchases and attract buyers.

Bundle Deal
This article teaches you how to use Seller Bundle Deal to increase the Average Order Value in your s…
Bundle Deal Terms and Conditions
As a special limited time promotion, we, sellers of certain products on TikTok Shop, are offering yo…
Promotional Tools - Shipping Fee Discount Eligibility
What are shipping fee discounts? You may choose to offer a shipping discount on orders by bearing al…

Gift with Purchase
This article teaches you how to use Gift with Purchase to increase your average order value and conv…

Seller LIVE Interactive Voucher
This article teaches you how to use LIVE Interactive Vouchers to increase your average order value a…

First order discount
If it is the customers first order, the discount coupon is only available for new user/customer who…

Seller Regular Voucher
This article teaches you how to use Seller Regular Vouchers to increase your average order value and…