

Shop Tab Analytics: Understand Your Data for Better Performance
09/30/2024
Shop Tab Analytics is an essential tool for gaining insight into your store’s performance and improving operational efficiency. By analyzing key metrics such as channel conversion rates and product performance, sellers can make data-driven decisions that enhance sales and visibility. Here’s how you can leverage this powerful feature:
 Shop Tab Analytics provides critical data points to help you track your overall business performance. These metrics include:
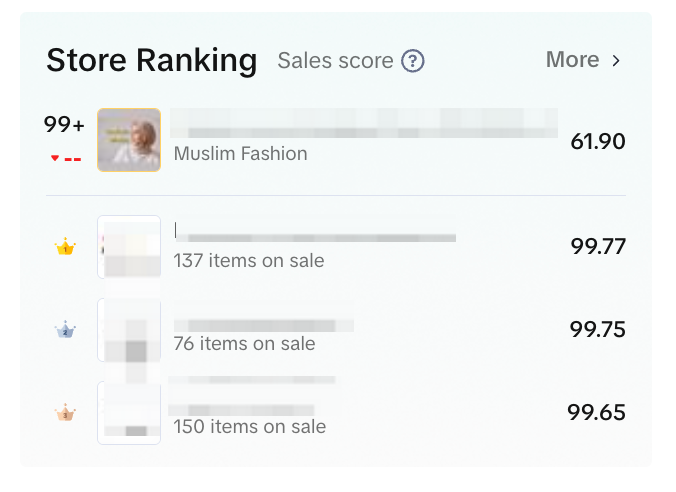 The Store Ranking feature provides an overview of where your store stands compared to others in the same category. The ranking is calculated based on sales data and growth trends, with a score between 0 and 100. While this score doesn't represent actual sales figures, it is a useful indicator of your store’s relative performance within its category.
 Key metrics include:
Use the data from Shop Tab Analytics to diagnose and enhance underperforming products. Optimize product details, titles, images, and descriptions to drive higher conversions.
Evaluate pricing strategies by comparing products with similar items in the market. Participate in flash sales and other promotions to increase product visibility and engagement.
Use funnel analysis to improve the shopping experience and identify issues that may be causing users to abandon the purchase process. This can help you increase conversion rates across multiple channels.
Business Performance Metrics
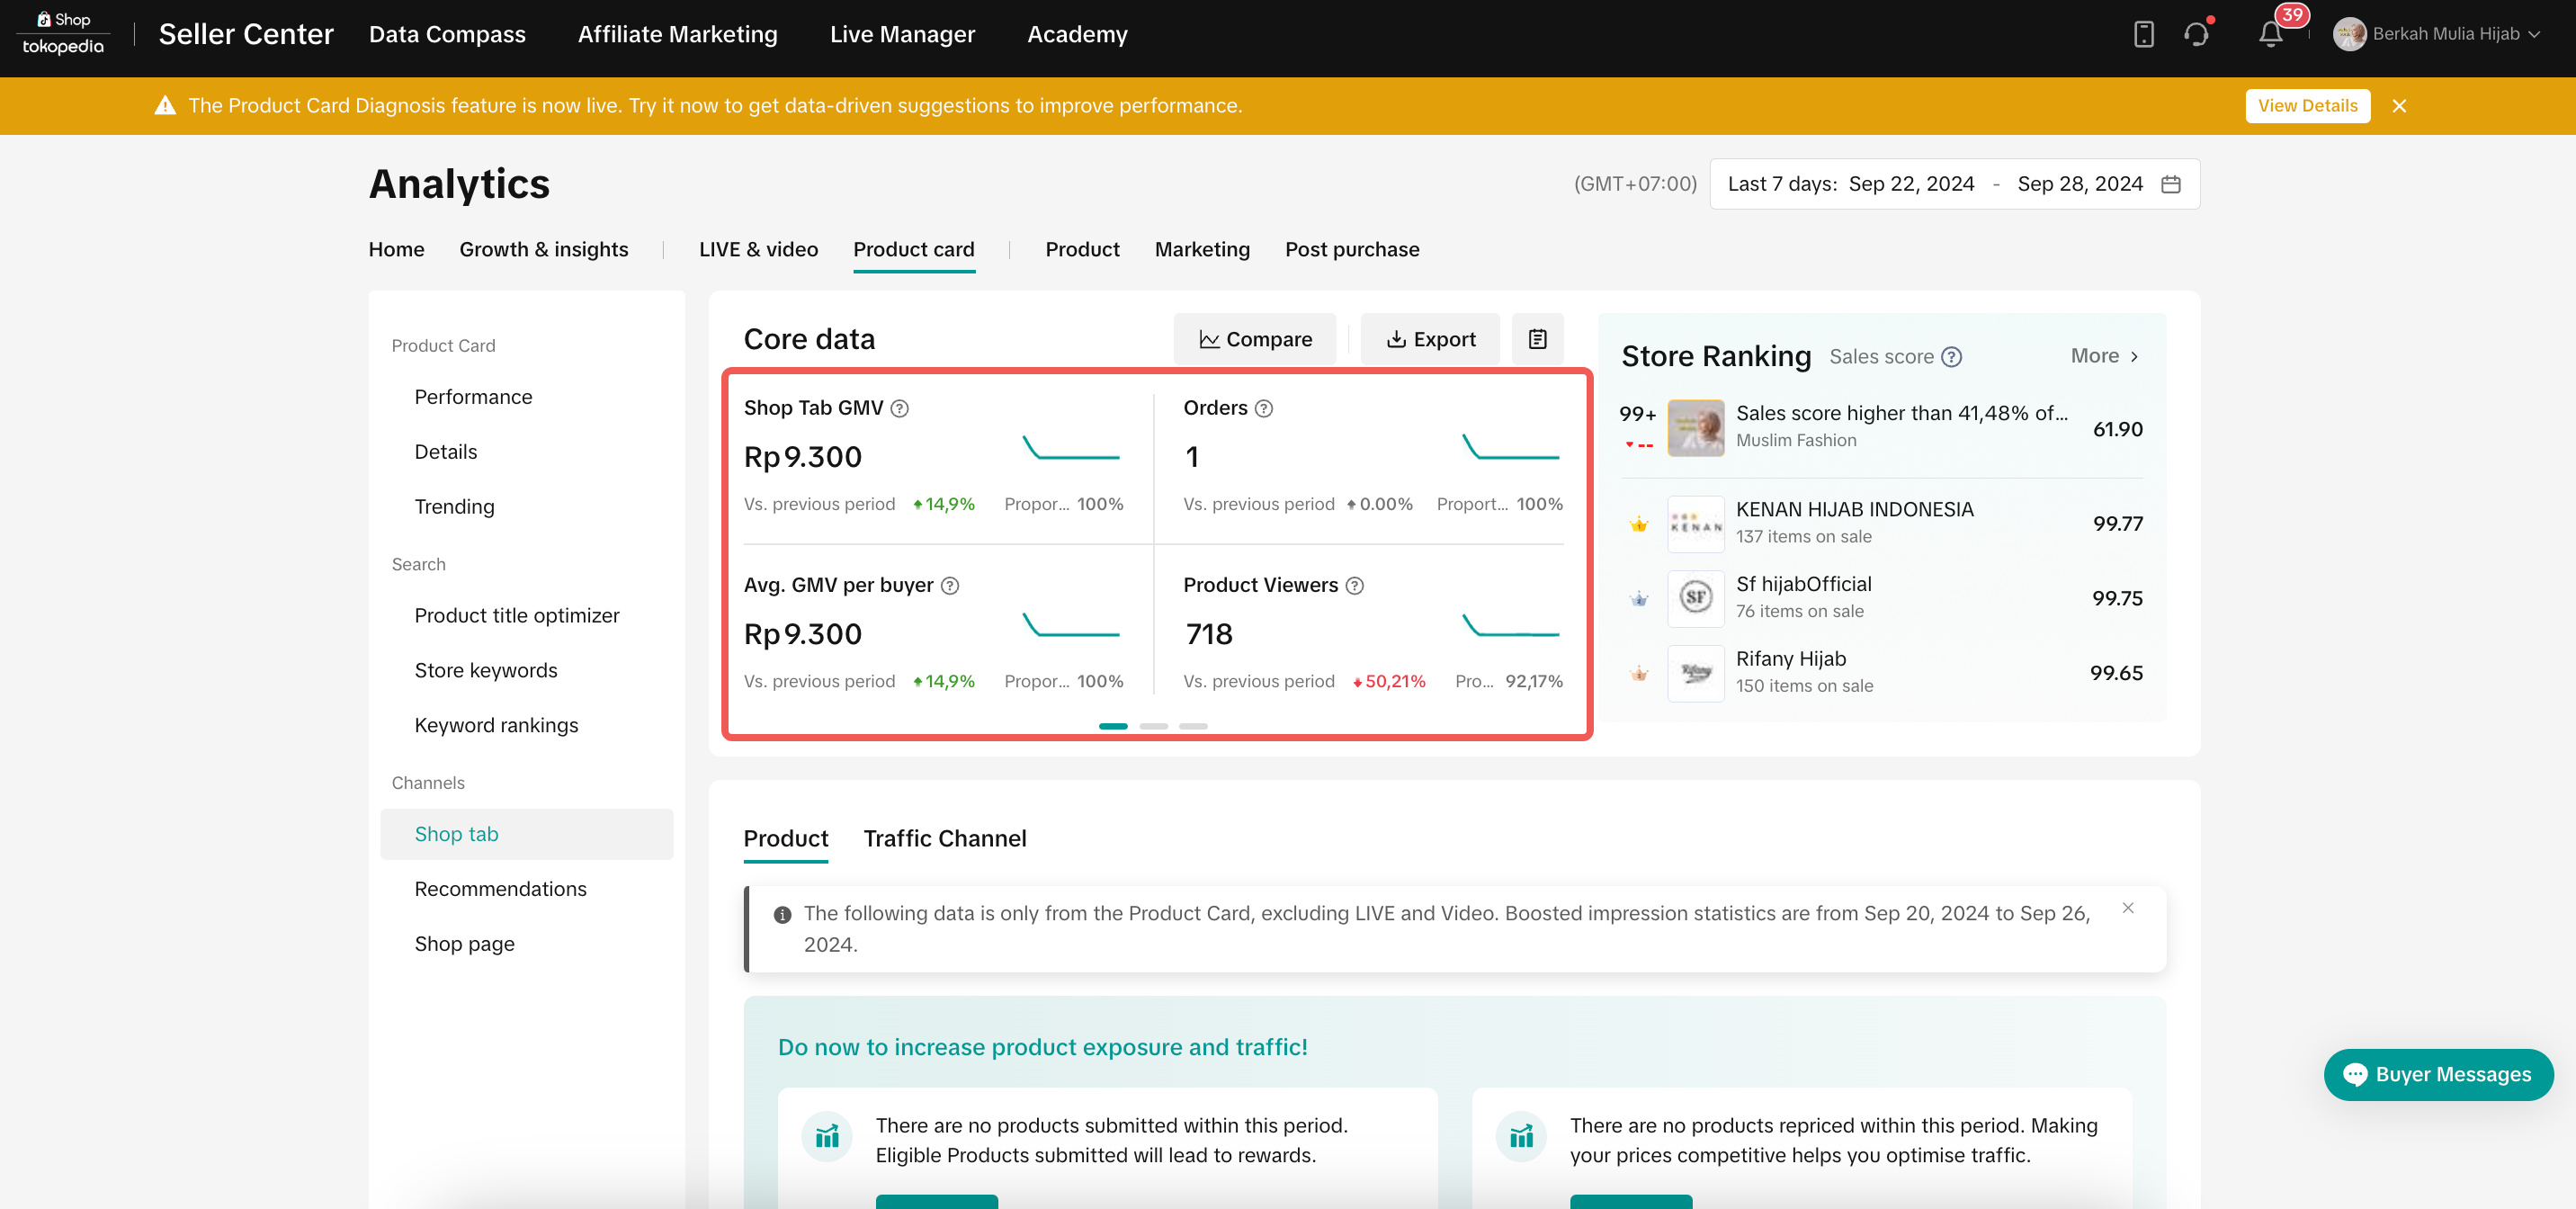
Core Data
- Shop Tab GMV: Total GMV generated through Shop Tab channels.
- Orders: Number of products sold through various Shop Tab sources.
- Avg. GMV per buyer: Average order value
- Clicks and Views: Measure the volume of user interactions with your product listings.
Store Ranking
Channel Analysis: Conversion Insights
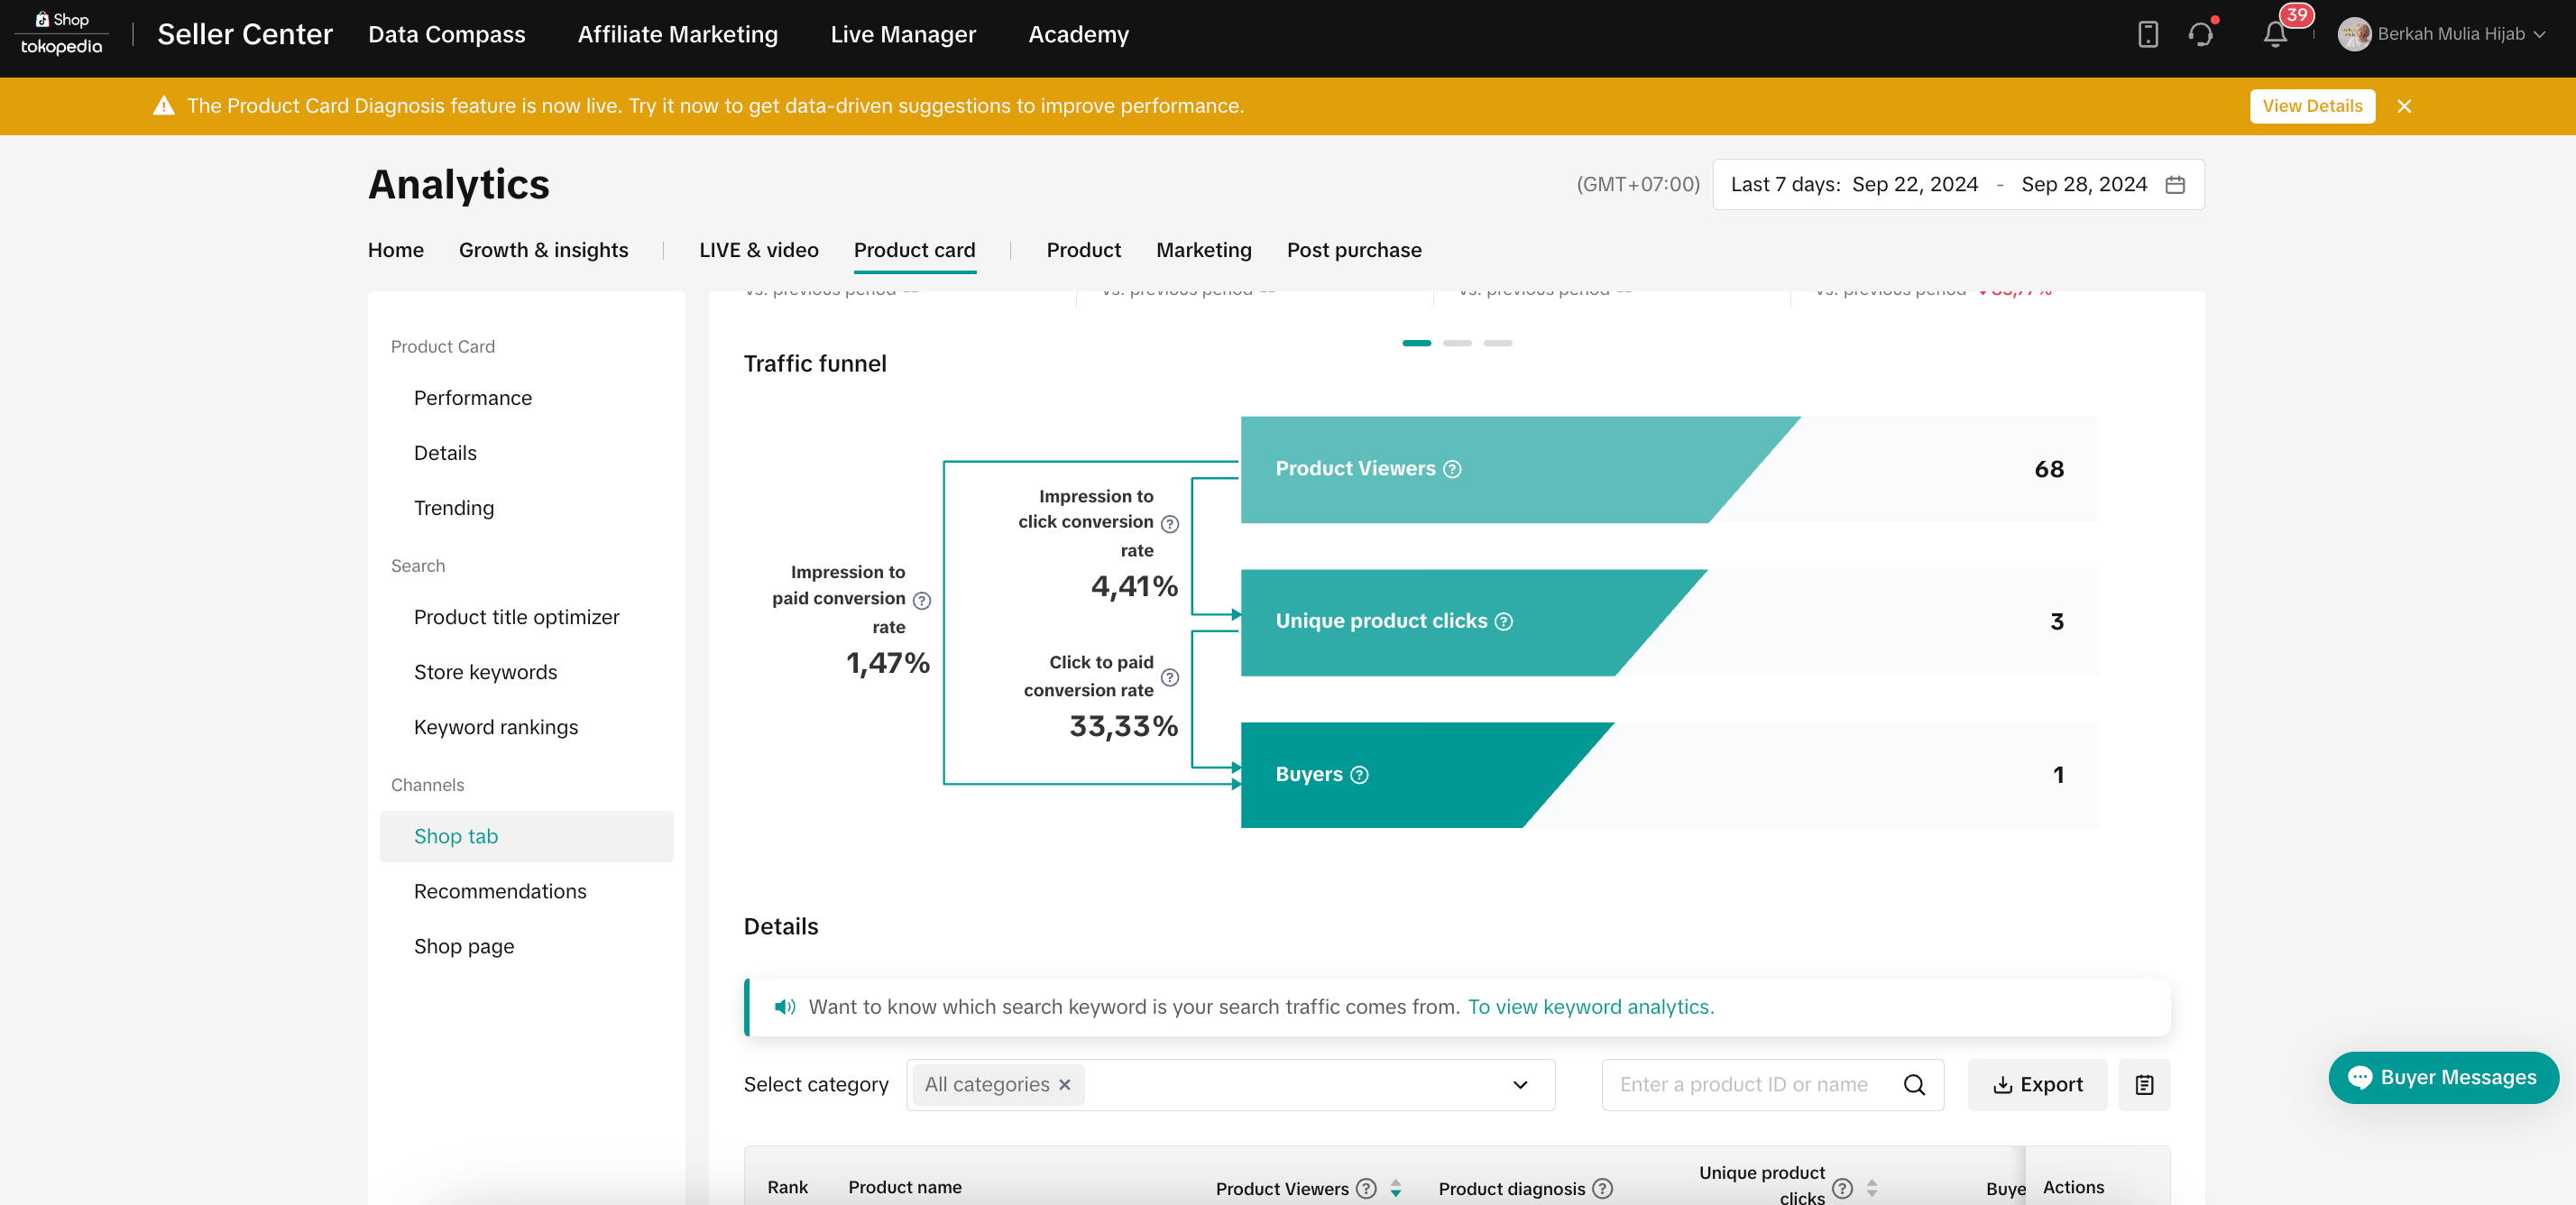
The Channel Analysis feature allows you to dive deeper into the performance of each sales channel, helping you identify strengths and areas for improvement. Here's how you can use it:Channel Conversion Funnels
The traffic conversion funnel provides detailed information about user retention and drop-off points. It shows the journey from when a user views a product to when they click and eventually make a purchase.- Impression-to-Click Conversion Rate: This metric reflects how many users clicked on a product after being exposed to it. Sellers can improve this by optimizing product images, titles, and descriptions to make the products more appealing.
- Click-to-Paid Conversion Rate: This metric shows the percentage of users who made a purchase after clicking on a product. To improve this rate, sellers can offer competitive pricing, use marketing tools like coupons, and improve product details.
Funnel Conversion Analysis
By using the funnel analysis tool, sellers can pinpoint where potential customers drop off during the buying process. For example, if you find that many users view your product but don’t click on it, it may be time to refresh the product’s visuals or improve the SEO in your product descriptions.Actionable Steps for Optimization
Product Optimization
:Use the data from Shop Tab Analytics to diagnose and enhance underperforming products. Optimize product details, titles, images, and descriptions to drive higher conversions.
Price and Promotion Management
:Evaluate pricing strategies by comparing products with similar items in the market. Participate in flash sales and other promotions to increase product visibility and engagement.
Funnel and Channel Insights
:Use funnel analysis to improve the shopping experience and identify issues that may be causing users to abandon the purchase process. This can help you increase conversion rates across multiple channels.
Conclusion
Shop Tab Analytics is a powerful tool that can help you gain a comprehensive understanding of your store's performance. By analyzing data on business metrics, channel conversions, and product rankings, sellers can optimize their stores for higher visibility, better conversion rates, and ultimately, more sales. Don’t forget to regularly review your analytics to make data-driven decisions and maximize your store’s potential on ShopTokopedia. 📊🚀You may also be interested in
- 1 lesson
Data Analytics
Utilize data analytics to track performance and make strategic decisions!
- 14 lessons
Product Tools & Partner
Discover essential tools and official TikTok Shop by Tokoepdia partners that help you streamline ope…
- 5 lessons
Data Compass
Introduction to data-driven decision-making tools for sellers to optimize their operations.

Data Analysis via Seller Center App
Summary This article teaches you what Data Analysis (via Seller Center App) is and what are the diff…

Financial Terms: Differences Between GMV & Settlement

Data Compass Overview
Summary This article teaches you about Data Compass Overview and the different modules available to…
Data Compass User Manual (PC)
Summary This article outlines all the different types of analytic pages accessible via Data Compass…

GMV Refinement for Clearer Customer Transactions