

Product Card Performance: Monitor & Optimize Your Product Visibility
12/29/2024
Product Cards are more than just visuals—they're your digital storefront. This guide will help you understand what Product Cards are, how they attract traffic, and how to analyze their performance effectively using Data Compass.

What Is a Product Card?
A Product Card displays the main data and content about each of your products, including the title, price, images, and description. But more importantly, it also shows performance metrics such as impressions, clicks, and conversions.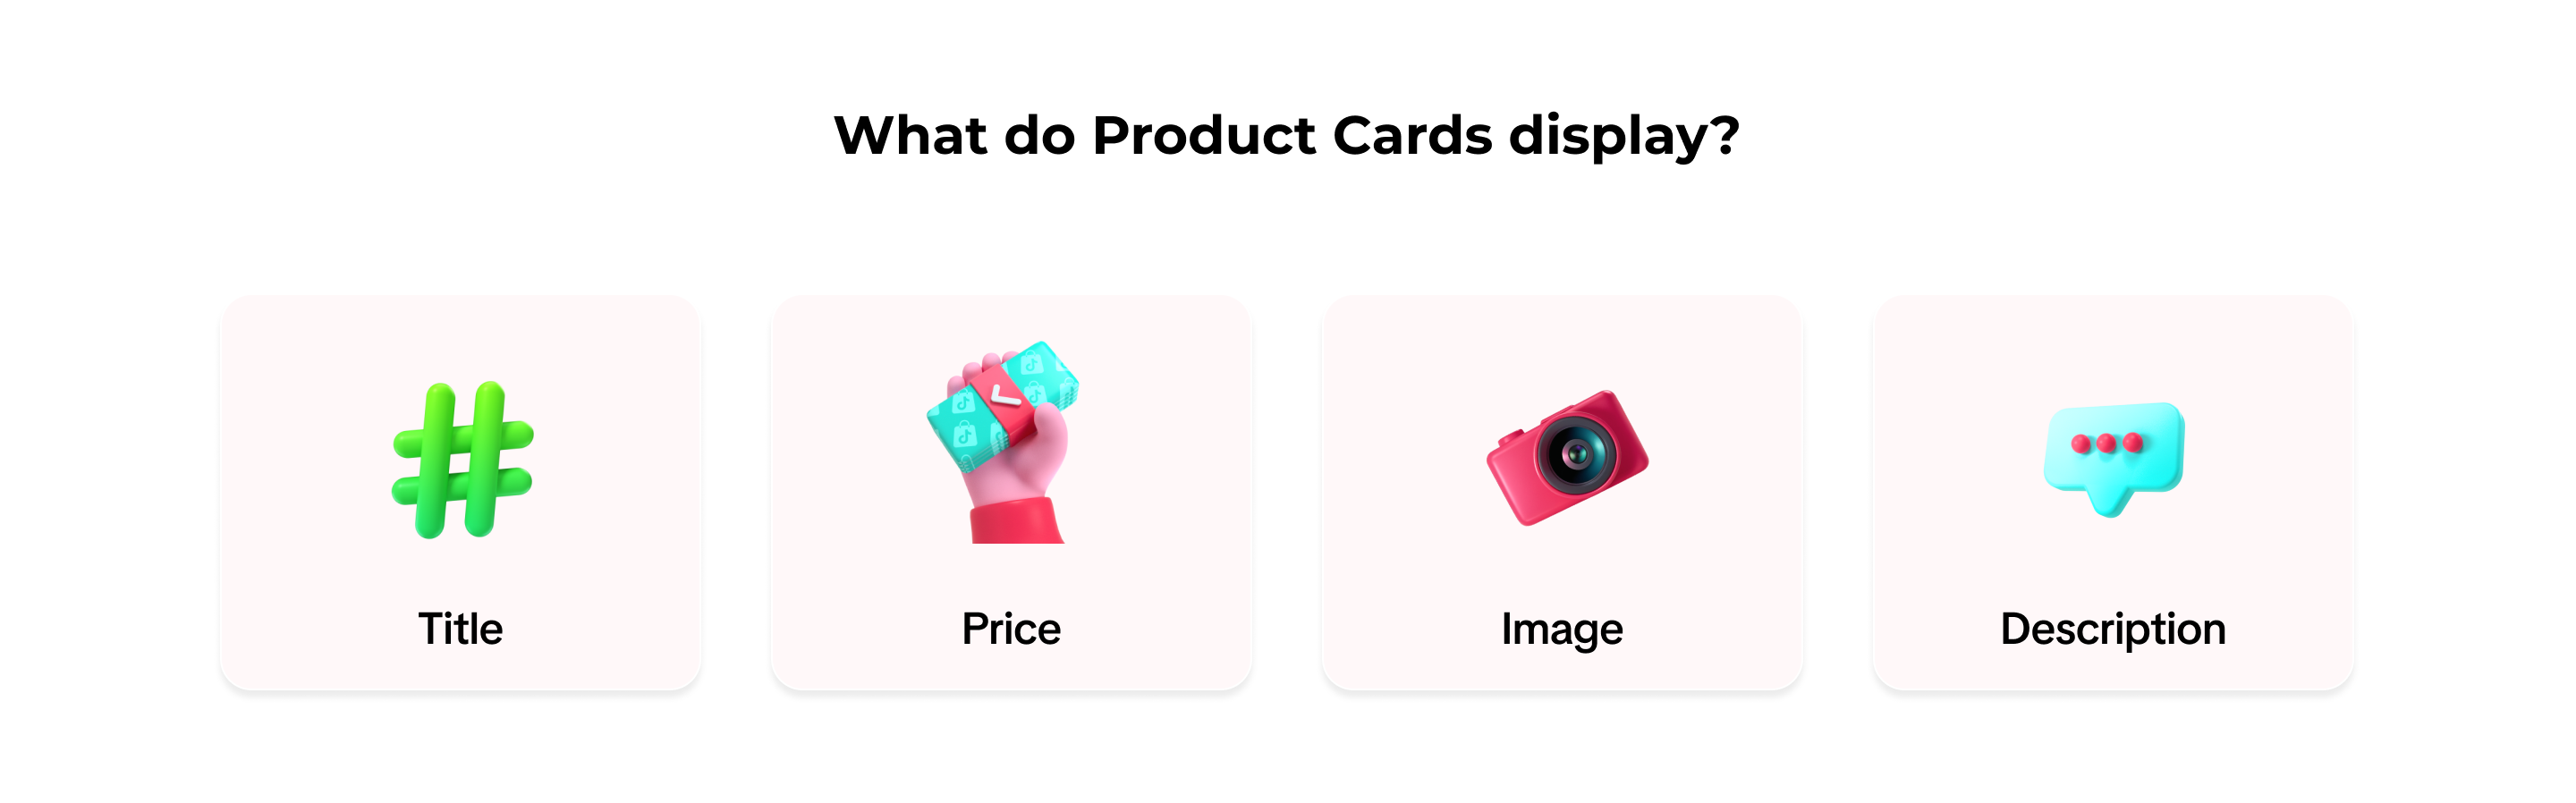

Why Check Your Product Card Data?
Checking your Product Card regularly helps you:Objective | Reason |
| 🎯 Identify traffic sources | Know where buyers are coming from (search, showcase, etc.) |
| 🚀 Optimize product ranking | Discover top-performing products by views or GMV |
| 🛠 Improve product content | Adjust titles, images, or descriptions based on real data |

How to Check Product Card Performance
Access the Performance DashboardGo to Seller Center → Click Data & Statistics → Select the Product Performance tab.
| 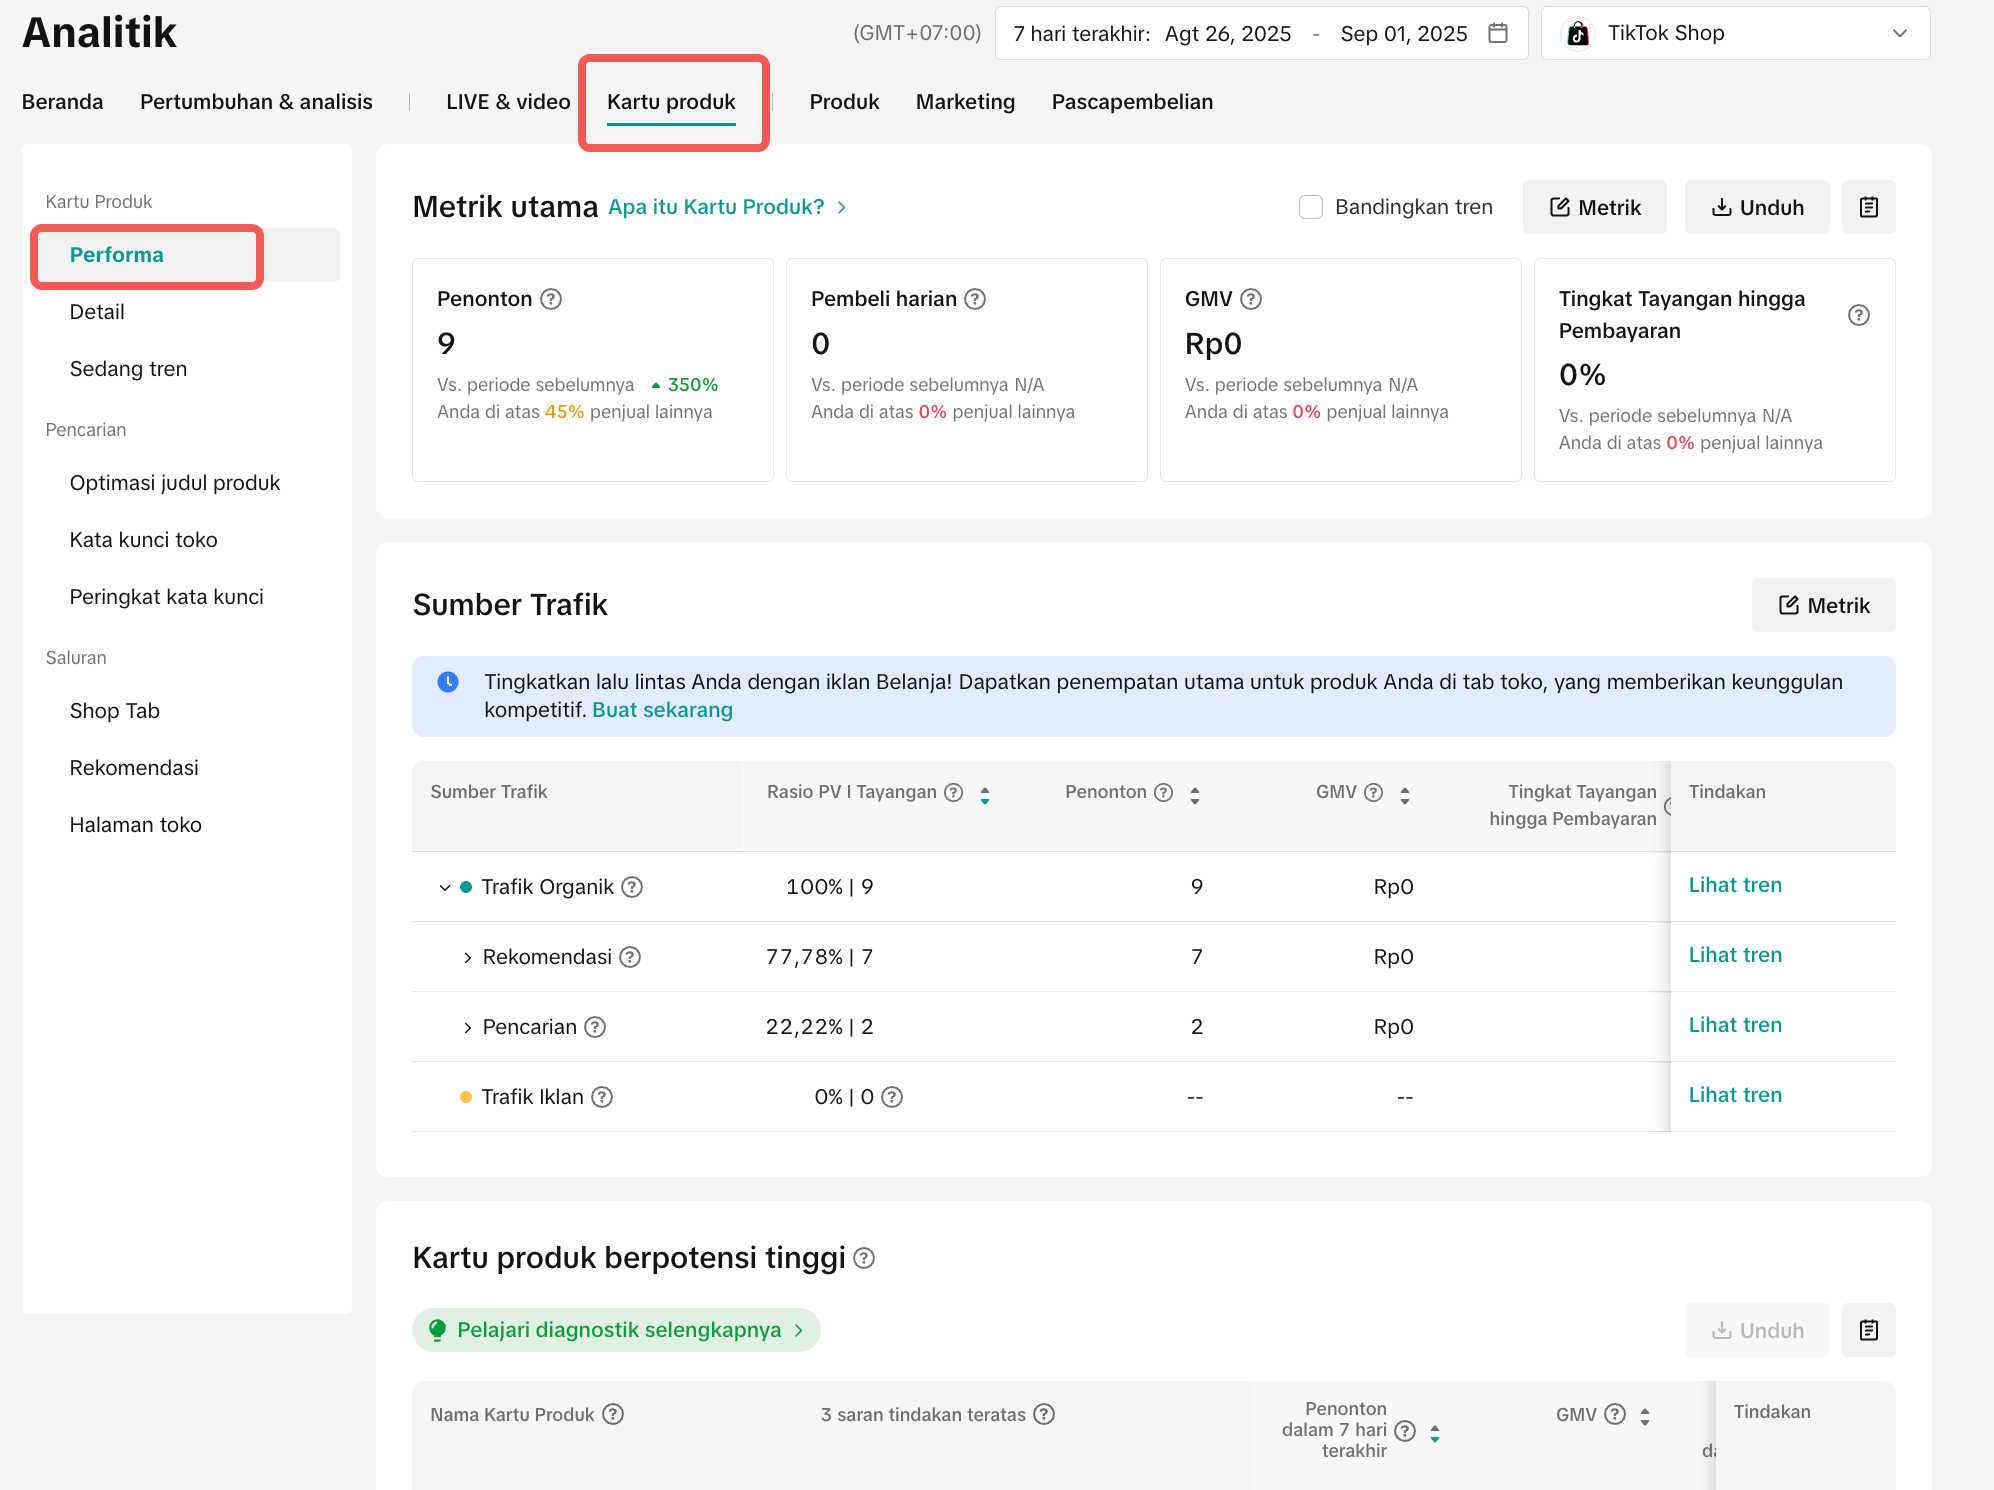 |
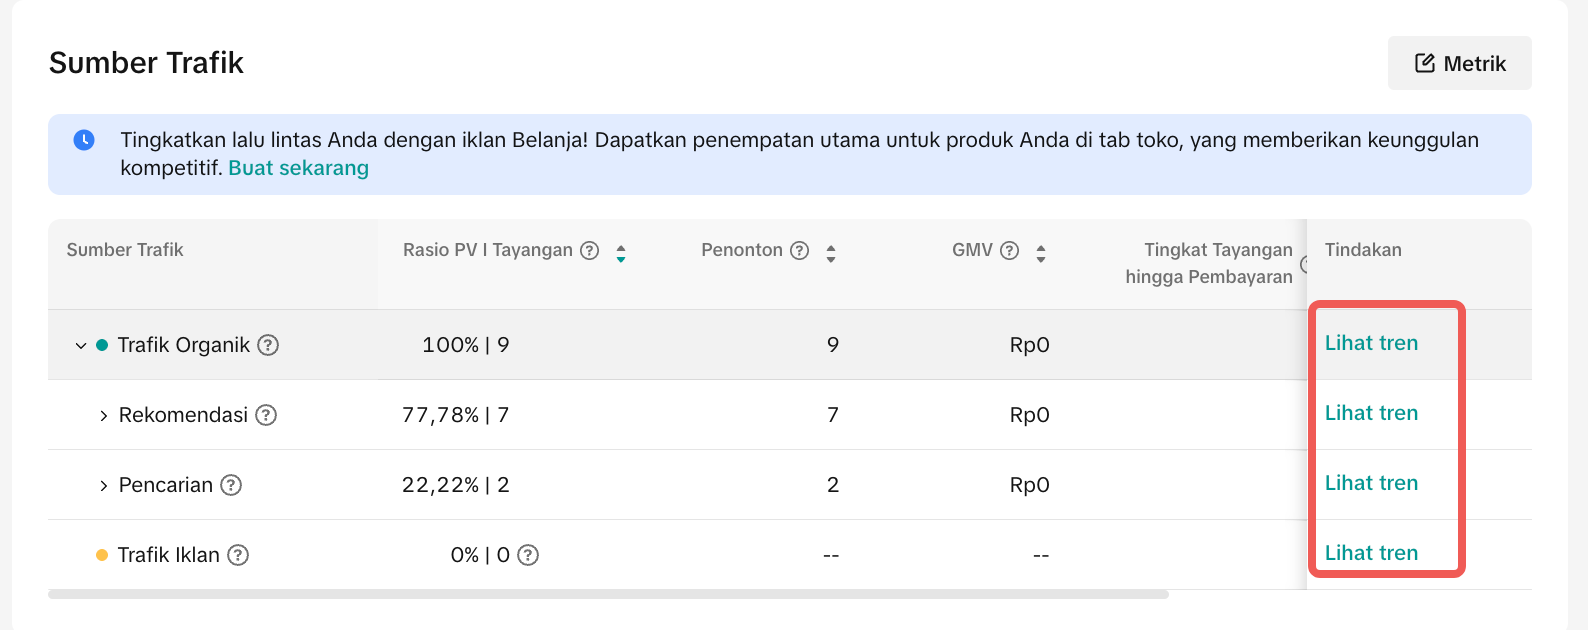
Analyze Product Traffic
|  |
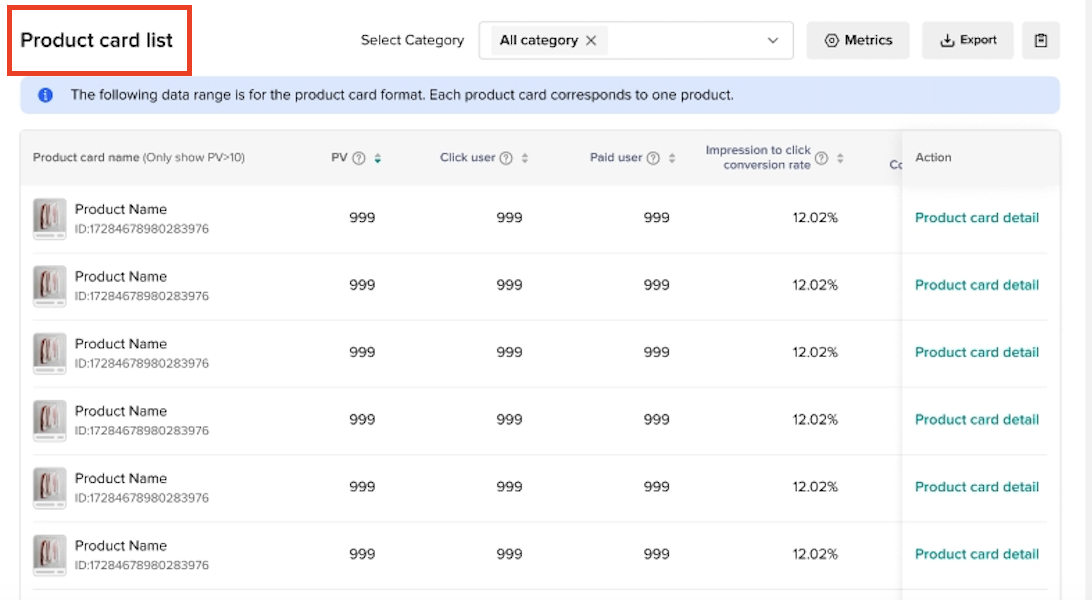
Check Product Ranking and Detail Metrics
|   |

What Sellers Often Miss When Analyzing Product Card
Many sellers use Product Card data but don’t make the most of it. Below are common mistakes, their consequences, and actionable ways to solve them:❌ Mistake | 🔍 What Happens | ✅ What to Do Instead |
| Only focusing on GMV | You miss early indicators like impressions or CTR, and can’t spot underperforming content | Check impressions, CTR, and GMV together to see the full funnel |
| Ignoring low click-through rate | High impressions but low clicks = your content isn’t attractive | Improve product image, thumbnail, or title to boost CTR |
| Not reviewing traffic source | You don’t know which channel (Search, LIVE, Ads, Showcase) brings the most traffic | Use Traffic Source tab to identify high-performing entry points |
| Using same content for all products | You assume what works for one product works for all | Customize title, image, and description based on product type and category behavior |
| Never testing content changes | You stick with the same setup even when performance drops | Run weekly A/B tests on visuals or keywords and track CTR improvement |
| Not filtering by date range | You can’t identify seasonal or campaign-driven changes | Always apply date filters to match promotional periods or recent changes |
| Ignoring mid- or low-ranked products | You focus only on top sellers, missing growth opportunities | Use ranking tab to find rising products with high CTR but low GMV, and promote them |

You may also be interested in
- 1 lesson
Shop Tab Analyize
Learn how to analyze your Shop Tab performance and make data-driven improvements.
- 3 lessons
Short Video Diagnosis
Review and analysis of short videos to pinpoint areas for improvement.
- 2 lessons
LIVE Traffic
Strategies to increase viewer count and engagement during livestreams, including techniques to attra…
- 1 lesson
Data Analytics
Utilize data analytics to track performance and make strategic decisions!
Product Card Diagnosis
This article teaches you how to use Product Card Diagnosis to improve product card performance using…

Video Diagnosis
This article will show you how to use the Video Diagnosis feature to create more engaging content as…

Video Performance
This article teaches you how to use Video Performance. Specifically, it will show you how to view yo…

Performa LIVE
This article teaches you how to use LIVE Performance. Specifically, it will show you how to view you…

LIVE Diagnosis
This article explains LIVE Diagnosis feature overview and how sellers can better prepare for your ne…

Data Analysis via Seller Center App
Summary This article teaches you what Data Analysis (via Seller Center App) is and what are the diff…