

Livestream Reports: Discover how you're performing and how to improve
12/13/2022
Livestream reports in Data Compass are here! Livestream reports help sellers compare the performance of their official account and marketing account livestreams with that of other sellers in the same category. The reports give information on key metrics as well as suggestions on how to improve. 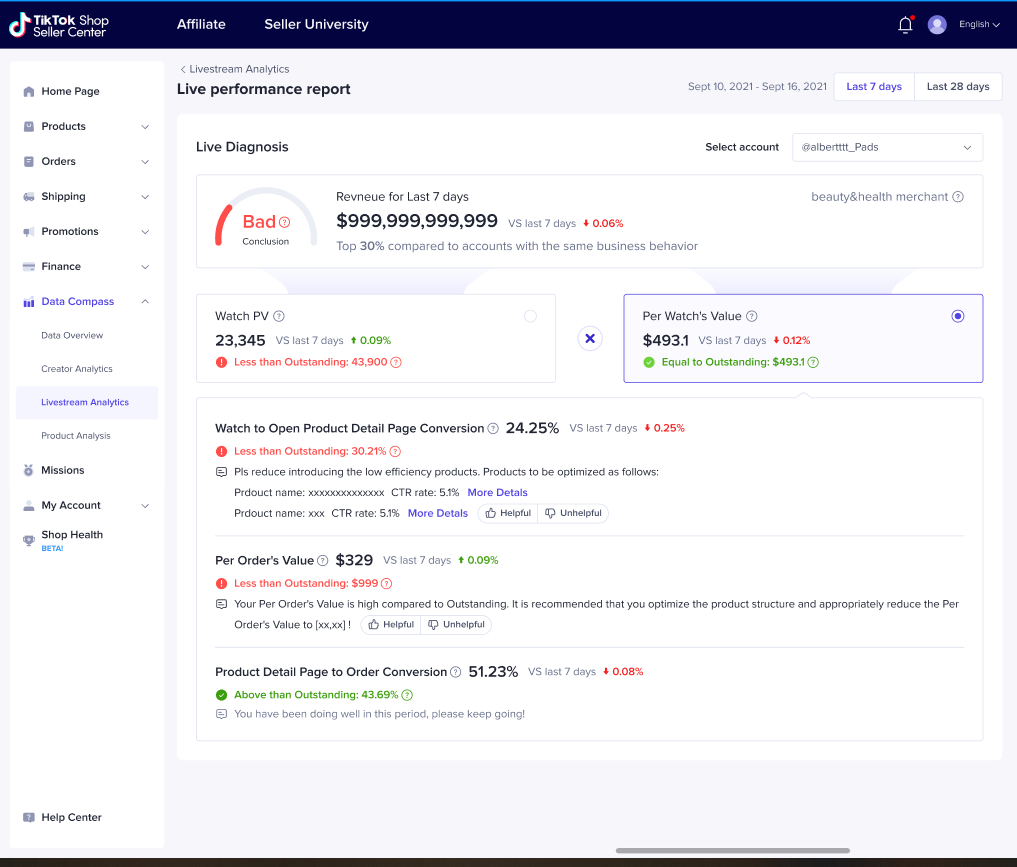
By analysing the metrics at each stage in the conversion journey, you can determine how to improve your revenue.
How can livestream reports help me improve my revenue?
🔥 Find out where you can improve
Why is your revenue from livestreaming so low?Is it because you don't have enough viewers? Why don't you have enough viewers?- Are your livestreams too short?
- Do you have too few impressions per hour?
- Do you need to work harder at getting users to view your livestream based on their impression?
- Do users see the product and click the product details page?
- After they open the product details page, do they make an order?
- What is the average value of each order?
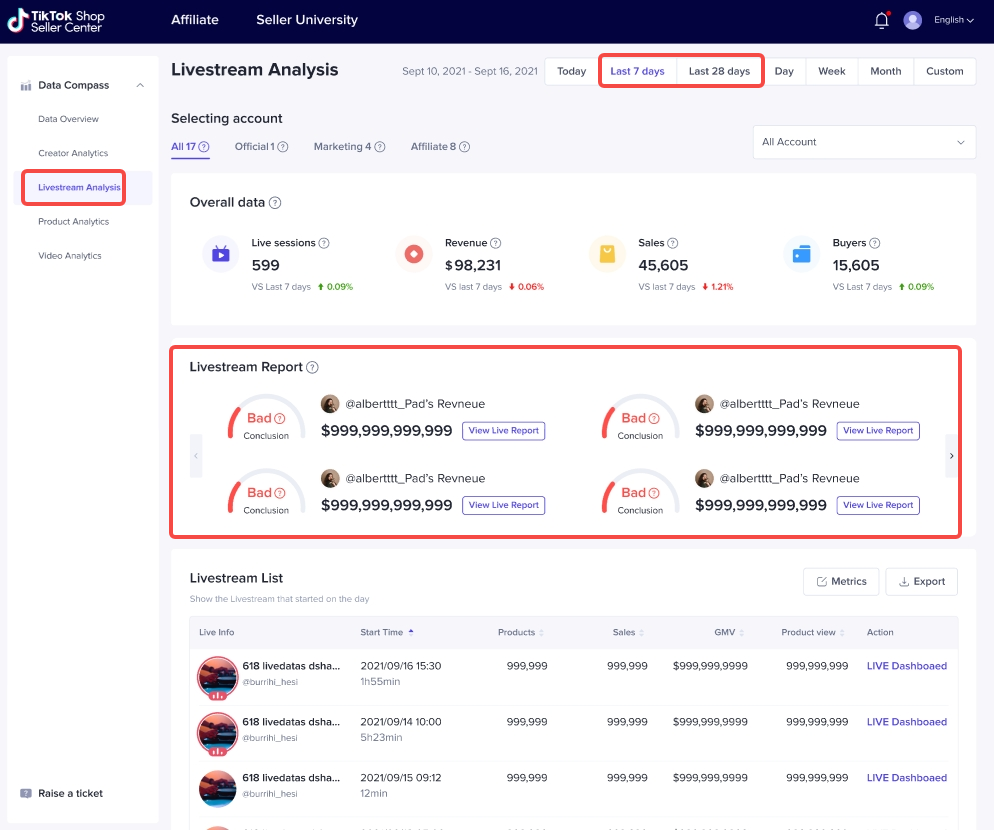
🔥 Benchmark your performance against other sellers
You can use livestream reports to benchmark your livestream performance against that of other, better-performing sellers at each stage of the conversion journey. This allows you to see how far you are behind other sellers, get an idea of what the best performing accounts achieve, and determine how much space you have to improve. You'll also see suggestions from the system on how to improve.Where to find Livestream reports
📣 Access:
Data Compass > Livestream Analytics > Select Last 7 Days or Last 28 Days > Livestream ReportsHow to understand livestream reports