

LIVE Basic Data Understanding & Anaysis
08/21/2025
Hi Seller!
Not sure what’s working (or not) in your LIVE sessions? Great content alone isn’t enough—what matters is what the data says. By understanding your LIVE performance through structured diagnosis, you can optimize every session and turn insights into sales.
Let’s explore how you can use the LIVE Dashboard on Data Compass to analyze, adjust, and improve every LIVE you run.


Core Components of Data Compass


 🚀 Try This NowReview your most recent LIVE using the LIVE Dashboard.
Identify one weak metric (e.g., CVR or engagement), apply 1–2 changes in your next session, and compare the result.
Not sure what’s working (or not) in your LIVE sessions? Great content alone isn’t enough—what matters is what the data says. By understanding your LIVE performance through structured diagnosis, you can optimize every session and turn insights into sales.
Let’s explore how you can use the LIVE Dashboard on Data Compass to analyze, adjust, and improve every LIVE you run.
Why LIVE Diagnosis Matters
Why You Should Track LIVE Performance:- Understand what went well or poorly in past sessions
- Find areas to improve, from traffic to product pitch
- Build smarter strategies for future sessions
- Benchmark against your own history or top-performing peers
🔁 The more you analyze, the better you can adjust and grow.
Using the LIVE Dashboard on Data Compass
Data Compass provides TikTok Shop by Tokopedia sellers with a dashboard to track performance. Monitor important metrics like Unique Viewers (UV), Page Views (PV), Peak Viewers, Watch Time, Conversion Rate (CVR), and Engagement to understand how well your sessions are performing.Core Components of Data Compass
 | 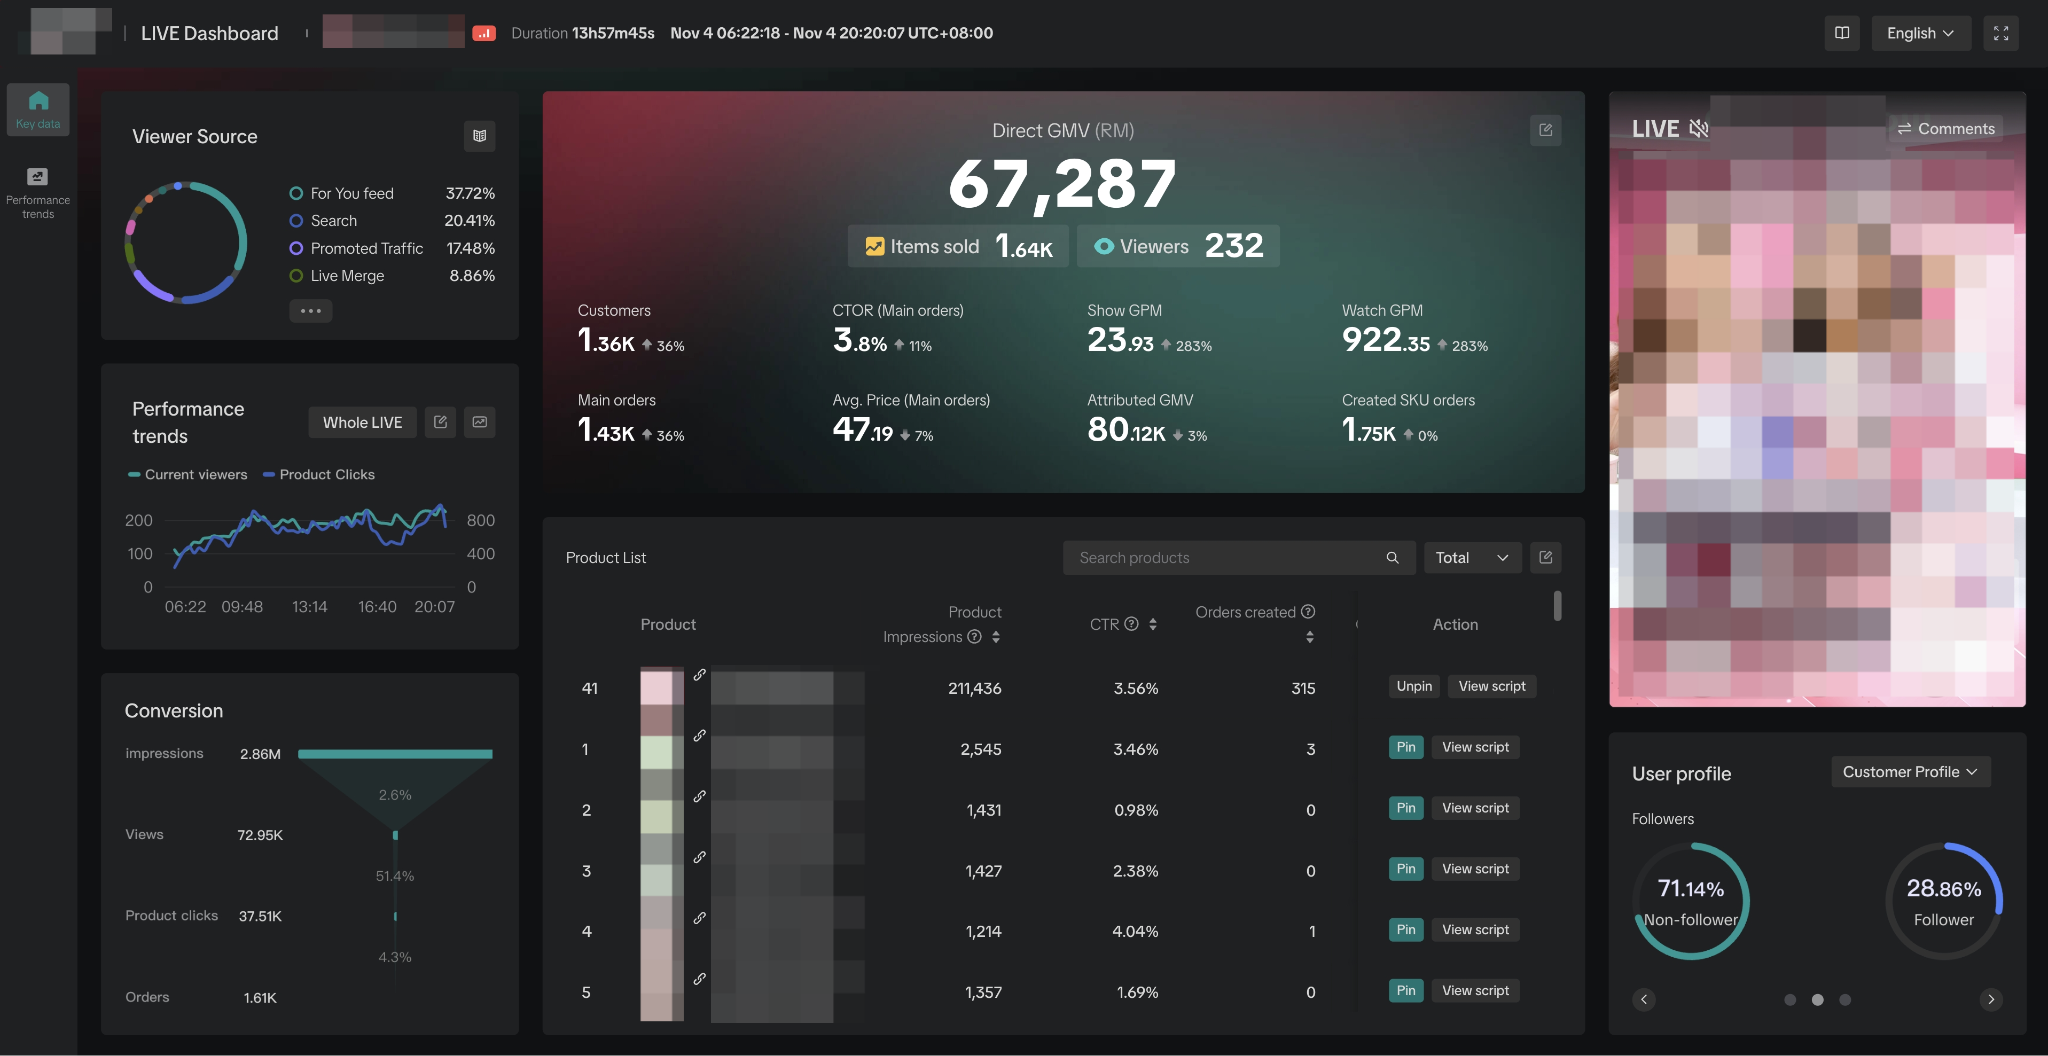 |
LIVE Dashboard on PC that aims to be the one-stop solution for monitoring your LIVE performance. From tracking the status and trends for important LIVE metrics, understanding traffic and conversion, to monitoring product SKU level performance and violations.
Key Metrics to Monitor in Your LIVE Dashboard
Use the LIVE Dashboard to track performance during and after each session. These metrics help you evaluate reach, engagement, and conversion across all areas.| Metrics | |||
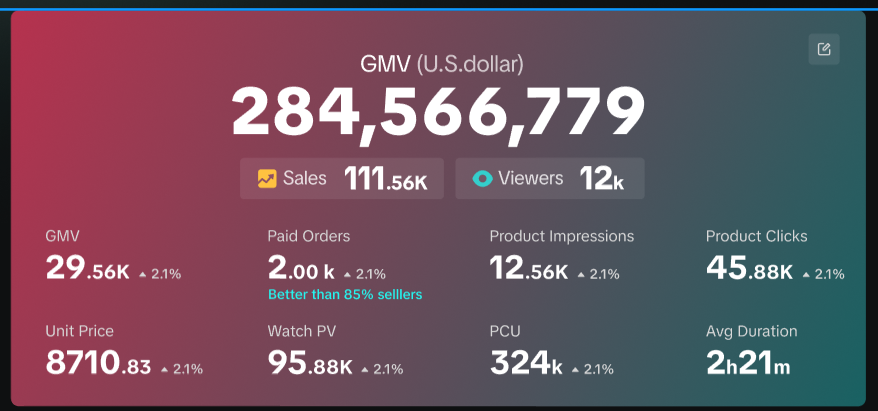 | 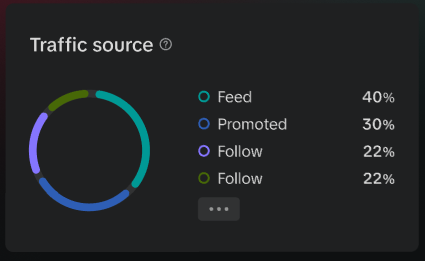 | 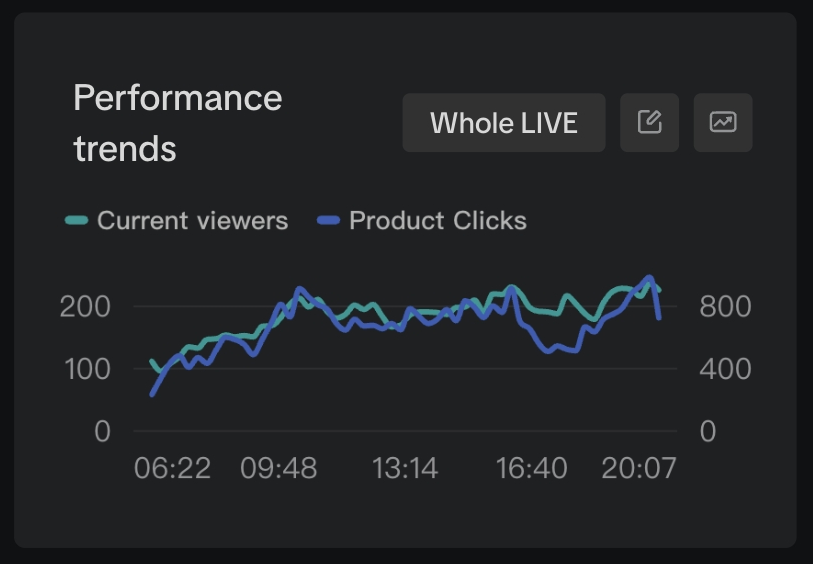 | 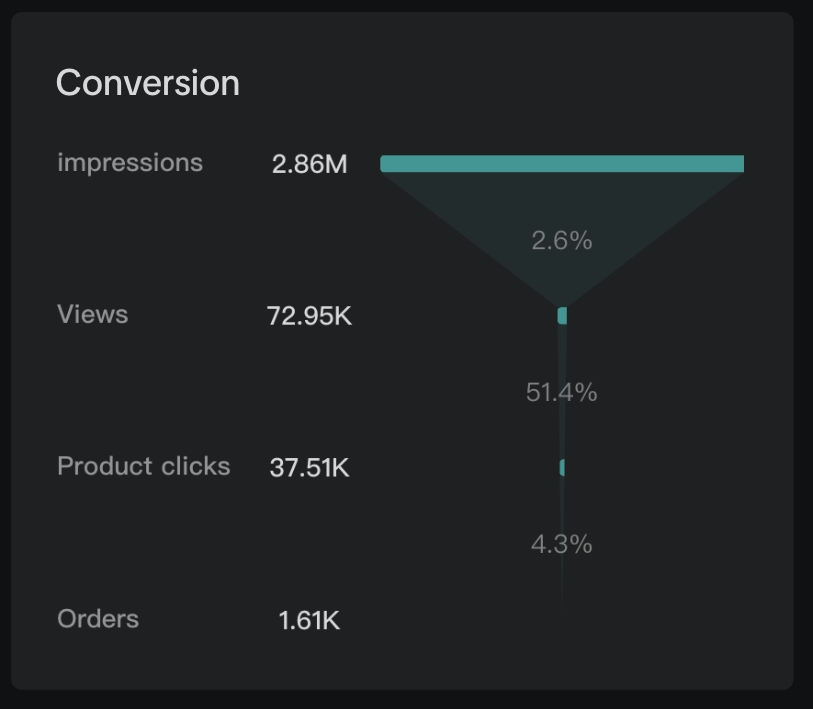 |
General LIVE session summary (UV, PV, duration, GMV, etc.) | Shows where your viewers are coming from (e.g., FYP, message tab, homepage) | Real-time viewer traffic per minute (entry, exit, peak moments) | Engagement data like comments, shares, product clicks |
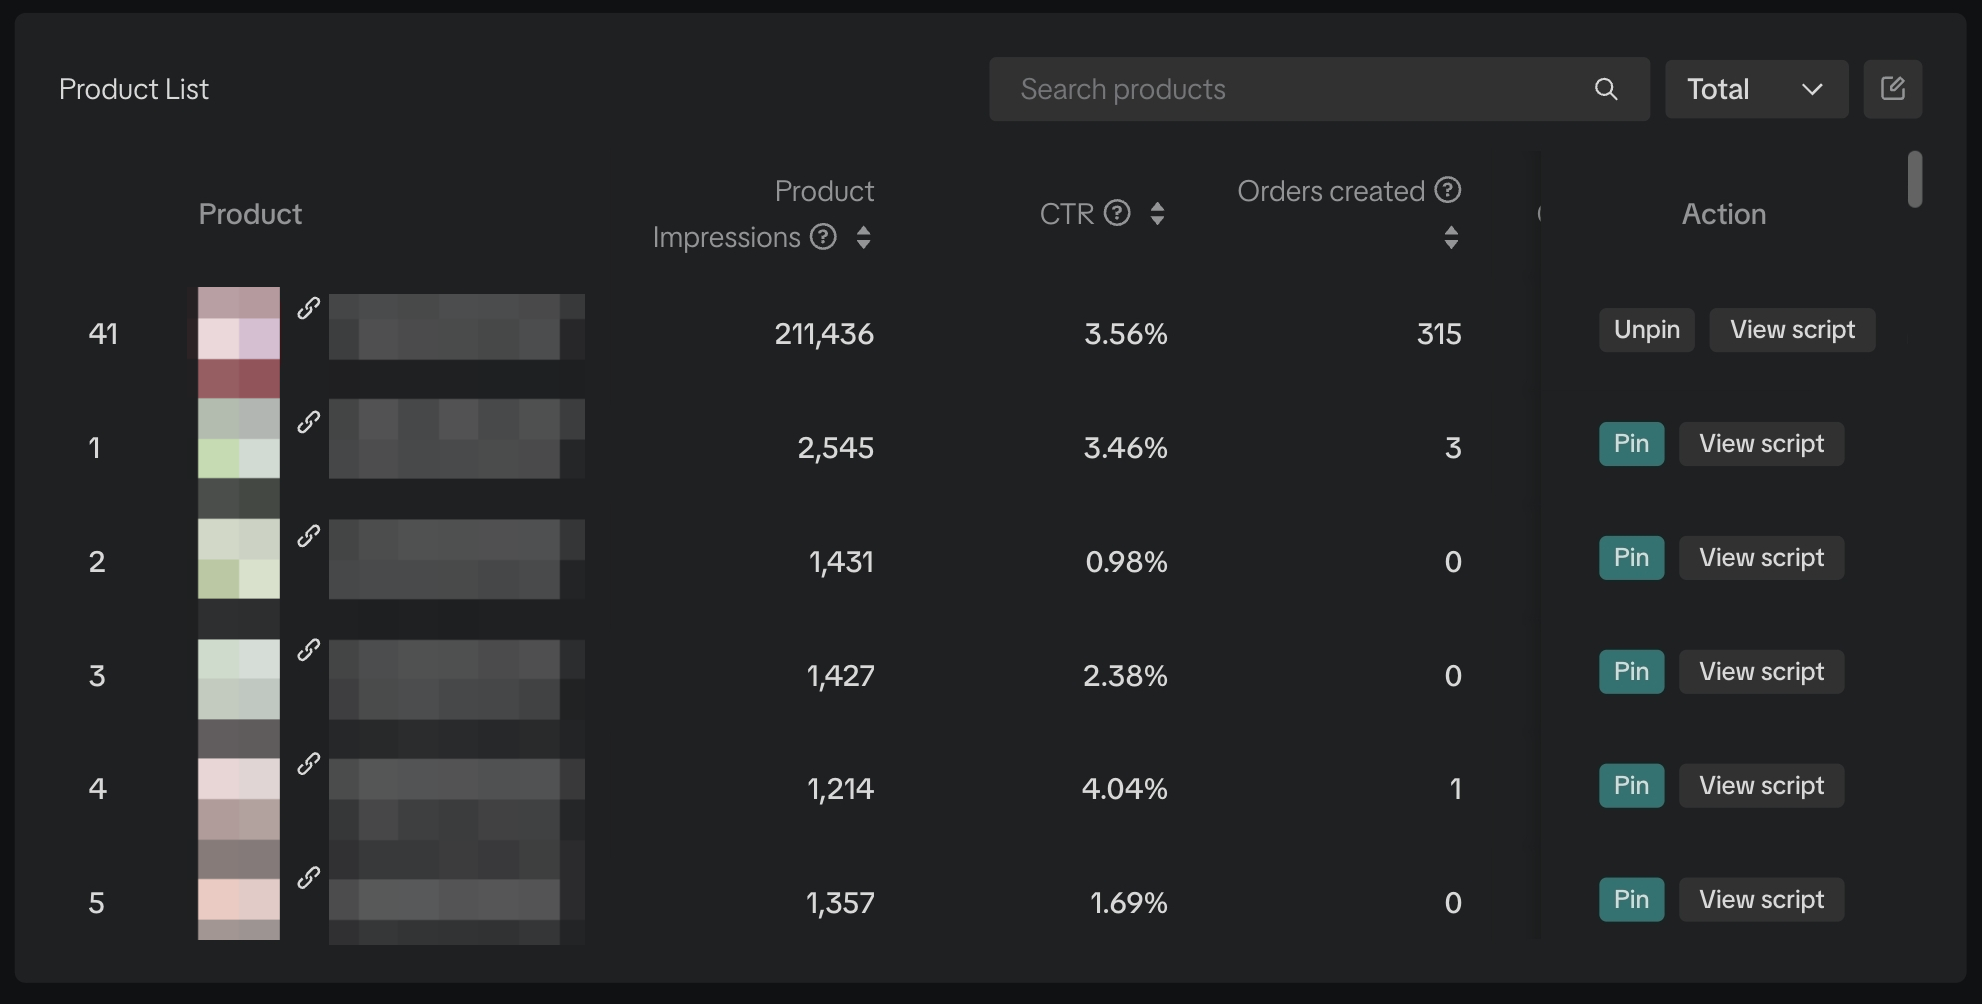 |  | 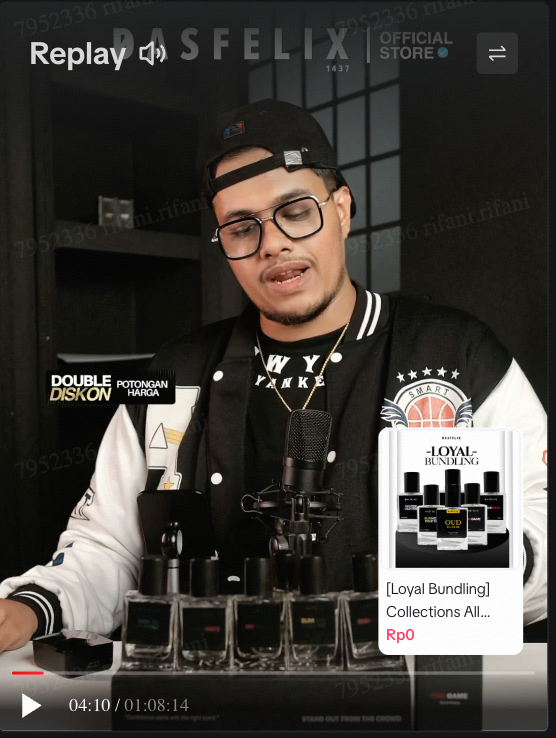 | |
Performance by SKU/product: views, clicks, conversions, CVR | Audience breakdown by gender, age, region, behavior | Watch back your session to evaluate pitch timing, product focus, and drop-offs | |
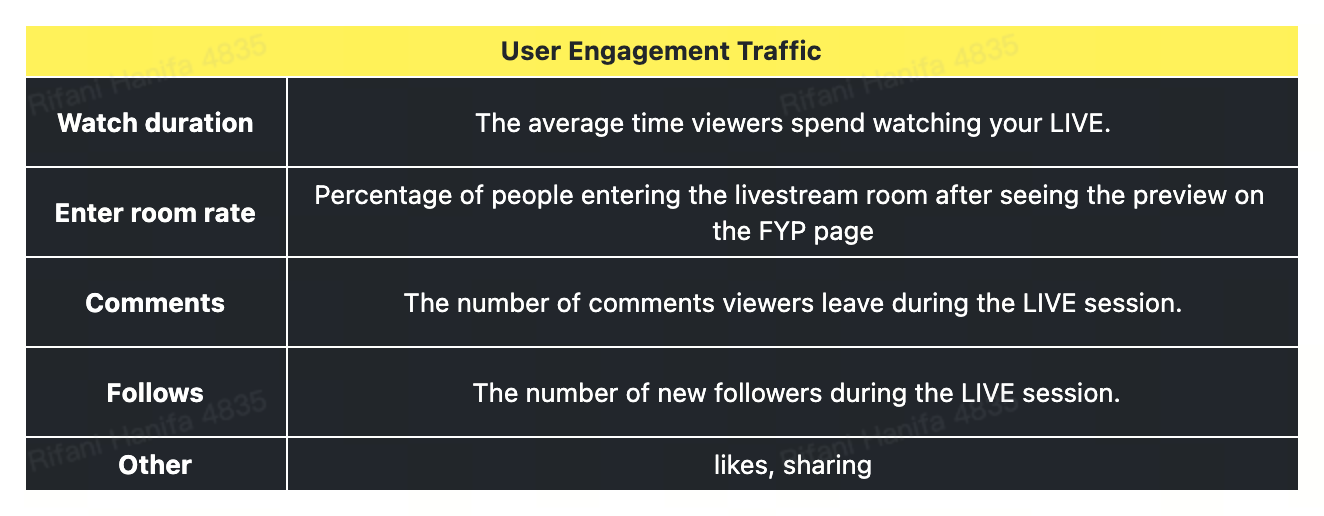 | 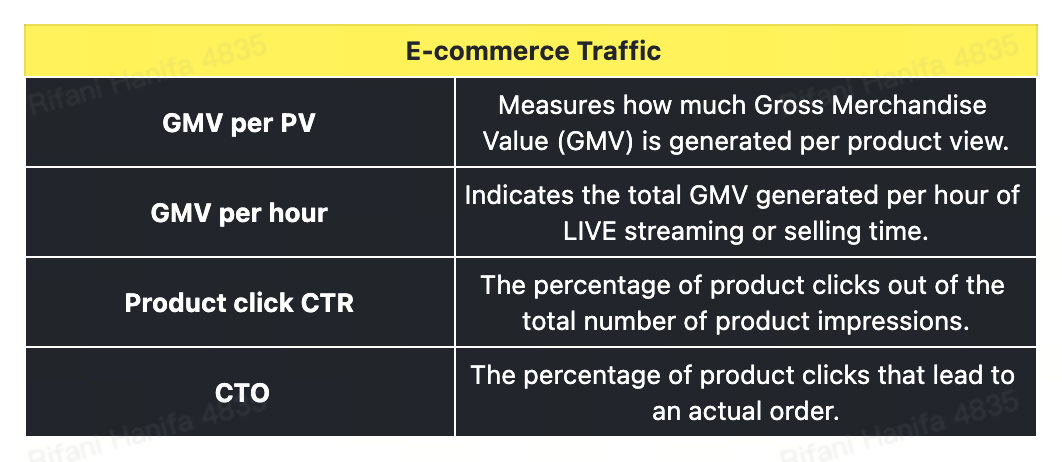 |
📈 Use these metrics to pinpoint your best moments, detect weak points, and adjust content, timing, or CTA placement.
How to Take Action Based on LIVE Data
Once you’ve reviewed the numbers, the next step is turning insights into improvement. Here's how to analyze your performance and adjust your next LIVE accordingly.Case Study: Compare Two LIVE Sessions
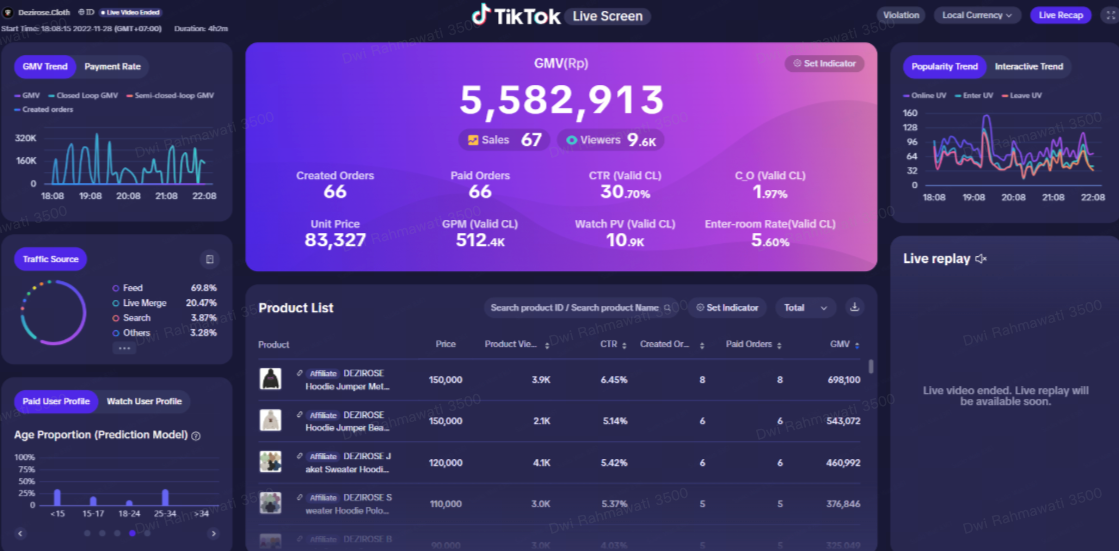 | 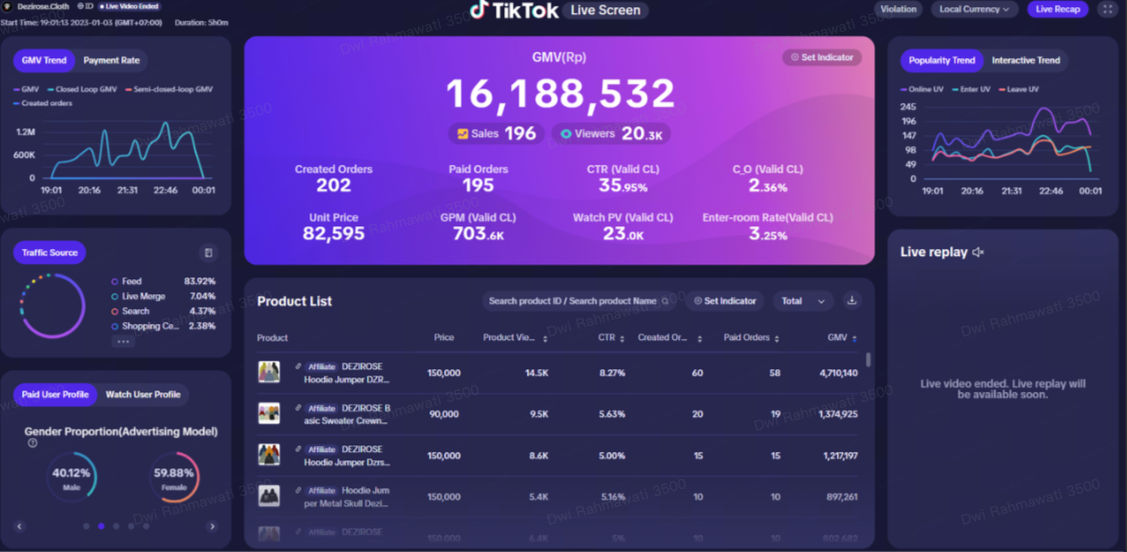 |
|
|
What to Improve Based on Data
- Engagement: Use gimmicks like giveaway banners, pin top products, and actively engage with viewers.
- Product explanation: Keep a clear product flow and explain each item thoroughly.
- Host setup: Use 2 hosts to increase responsiveness and energy.
- Content quality: Add banners, product visuals, and interactive structure.
- LIVE duration: Extend if engagement remains high.
Observe → Modify → Practice → EvaluateGreat LIVE performance requires consistent review and improvement.
📌 Recommended Content Habit🔹 Host 5 livestreams per day, with 2 hours per sessionThe more you go LIVE, the more insights you’ll gain for performance improvement.
🚀 Try This NowReview your most recent LIVE using the LIVE Dashboard.Identify one weak metric (e.g., CVR or engagement), apply 1–2 changes in your next session, and compare the result.
📈 Track, test, adjust, repeat—and your LIVE results will grow every week.
Trước đóAffiliate Center: Manage Collaborations Easier and SmarterNext Settlement TikTok Shop by Tokopedia: Rahasia Mengelola Penghasilan dan Pembayaran
Có thể bạn cũng quan tâm về
- 2 lessons
LIVE Traffic
Strategies to increase viewer count and engagement during livestreams, including techniques to attra…
- 5 lessons
Data Compass
Introduction to data-driven decision-making tools for sellers to optimize their operations.
Performa LIVE
This article teaches you how to use LIVE Performance. Specifically, it will show you how to view you…
LIVE Diagnosis
This article explains LIVE Diagnosis feature overview and how sellers can better prepare for your ne…