

Data Compass Overview: Monitor and Optimize Your Business with Confidence
12/29/2024
Ever wondered how your shop is really performing on TikTok Shop by Tokopedia? With Data Compass, you can stop guessing and start making data-driven decisions that actually grow your business.

What is Data Compass?
Data Compass is your all-in-one analytics dashboard in TikTok Shop by Tokopedia. It gives you real-time, comprehensive insights across every key part of your business — from orders and traffic to conversion, customer behavior, and content performance.You can use it to:
|
|

Why Use Data Compass?
Benefit | Description |
| ✅ Real-time data | Make decisions based on live updates from your shop activity |
| ✅ Visual dashboard | Easy-to-read charts and metrics to understand your performance |
| ✅ End-to-end tracking | Track everything from traffic to transaction and conversion |
| ✅ Improve content & sales | Get insights to boost LIVE, short videos, and promotion effectiveness |

Where to Find Data Compass
To access it:
| 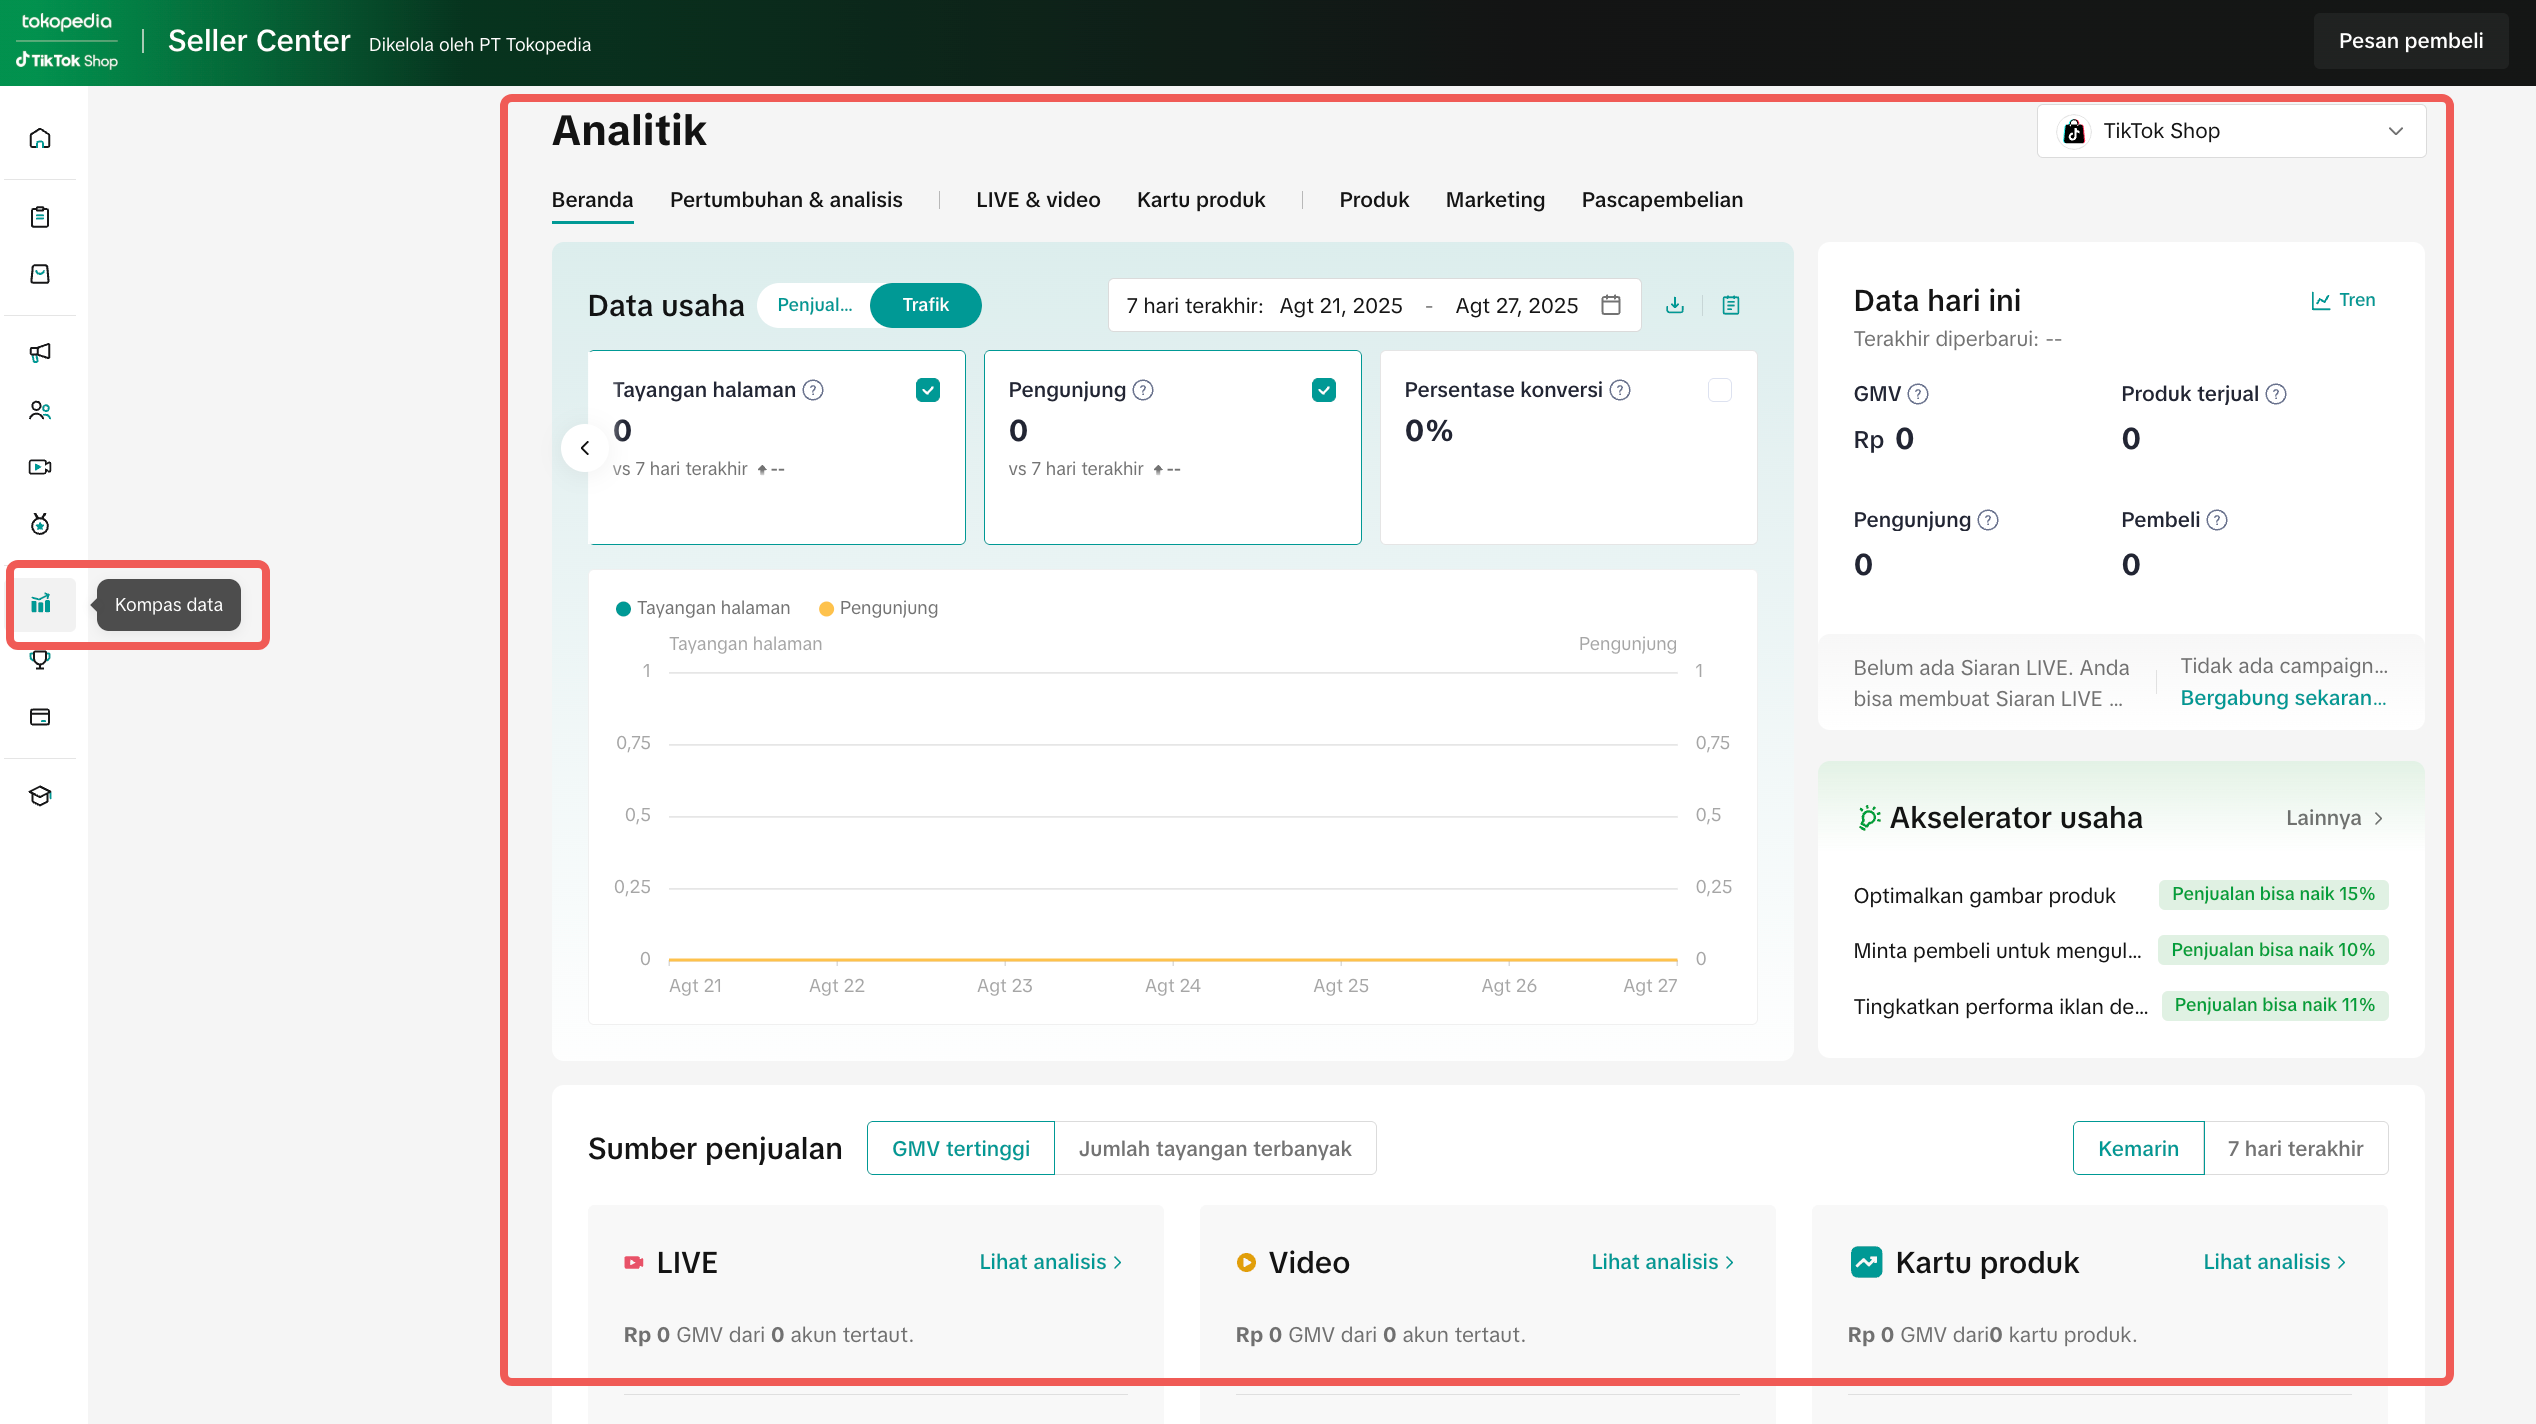 |

Track Overall Shop Growth
If your sales are stagnant, Data Compass can help you identify weak spots in Assortment, Content, and Empowerment (ACE).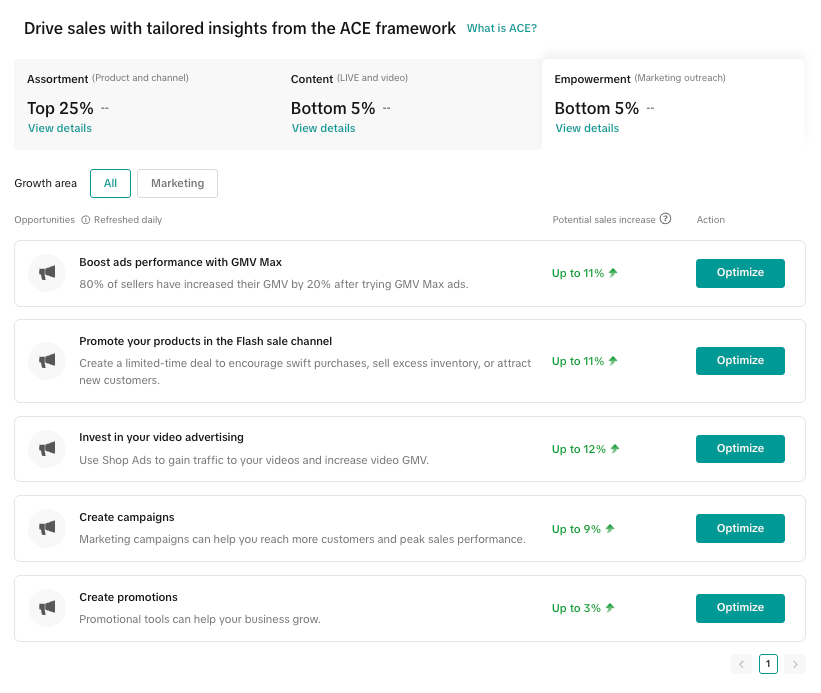 | Start with:
|
Analyze Content Performance: Short Video & LIVE
If your short video or LIVE content isn’t converting, use these key metrics to spot what’s missing and how to fix it:Metric | Meaning | Common Issue | Optimization Tips |
| Impressions | How many people see your content | Low impressions = low reach | Use trending keywords in titles, descriptions & hashtags. Use the Keyword Tool to pick high-performing keywords |
| ERR% (Enter Room Rate) | How many people enter your LIVE after seeing it | People see but don’t click LIVE | Use urgent cover titles like “Only 10 Left!” or “Flash Sale LIVE Now” |
| CTR (Click-Through Rate) | Are viewers engaging with your content? | Unattractive thumbnails, hooks, or captions | Try bolder thumbnails, stronger headlines, and clearer CTAs (e.g., “Watch Now”) |
| CO% (Conversion Rate) | Are viewers actually buying? | Product pitch not persuasive | Improve images, descriptions, and use discounts/vouchers to trigger urgency |

Your Daily Checklist with Data Compass
- Check top underperforming content using filters
- Compare performance before and after a promo
- Use audience insights before launching LIVE
- Export weekly data for team sync-up
- Set one focus metric per week (e.g., CTR) and test changes

Go to Seller Center > Data Compass and start turning insights into growth—only on TikTok Shop by Tokopedia.
You may also be interested in
- 3 lessons
Short Video Diagnosis
Review and analysis of short videos to pinpoint areas for improvement.
- 2 lessons
LIVE Traffic
Strategies to increase viewer count and engagement during livestreams, including techniques to attra…
- 1 lesson
Data Analytics
Utilize data analytics to track performance and make strategic decisions!
- 14 lessons
Product Tools & Partner
Discover essential tools and official TikTok Shop by Tokoepdia partners that help you streamline ope…

Video Diagnosis
This article will show you how to use the Video Diagnosis feature to create more engaging content as…
Video Performance
This article teaches you how to use Video Performance. Specifically, it will show you how to view yo…
Performa LIVE
This article teaches you how to use LIVE Performance. Specifically, it will show you how to view you…
LIVE Diagnosis
This article explains LIVE Diagnosis feature overview and how sellers can better prepare for your ne…

Data Analysis via Seller Center App
Summary This article teaches you what Data Analysis (via Seller Center App) is and what are the diff…

Financial Terms: Differences Between GMV & Settlement