

Campaign Dashboard
02/12/2025
This article will help you understand what Campaign Dashboard is and how you can view and analyse your campaign performance in real-time! Campaign Dashboard is available on mega campaigns (e.g. Double-digit campaigns), and selected campaigns (e.g. Payday, Weekly Sale, Mid-Month Sale etc). The data displayed on this page is based on the data source selected at the top of the page; ShopTokopedia and Tokopedia.*All information displayed on the dashboard is fictional and used for demonstration purposes only. Actual interface may vary.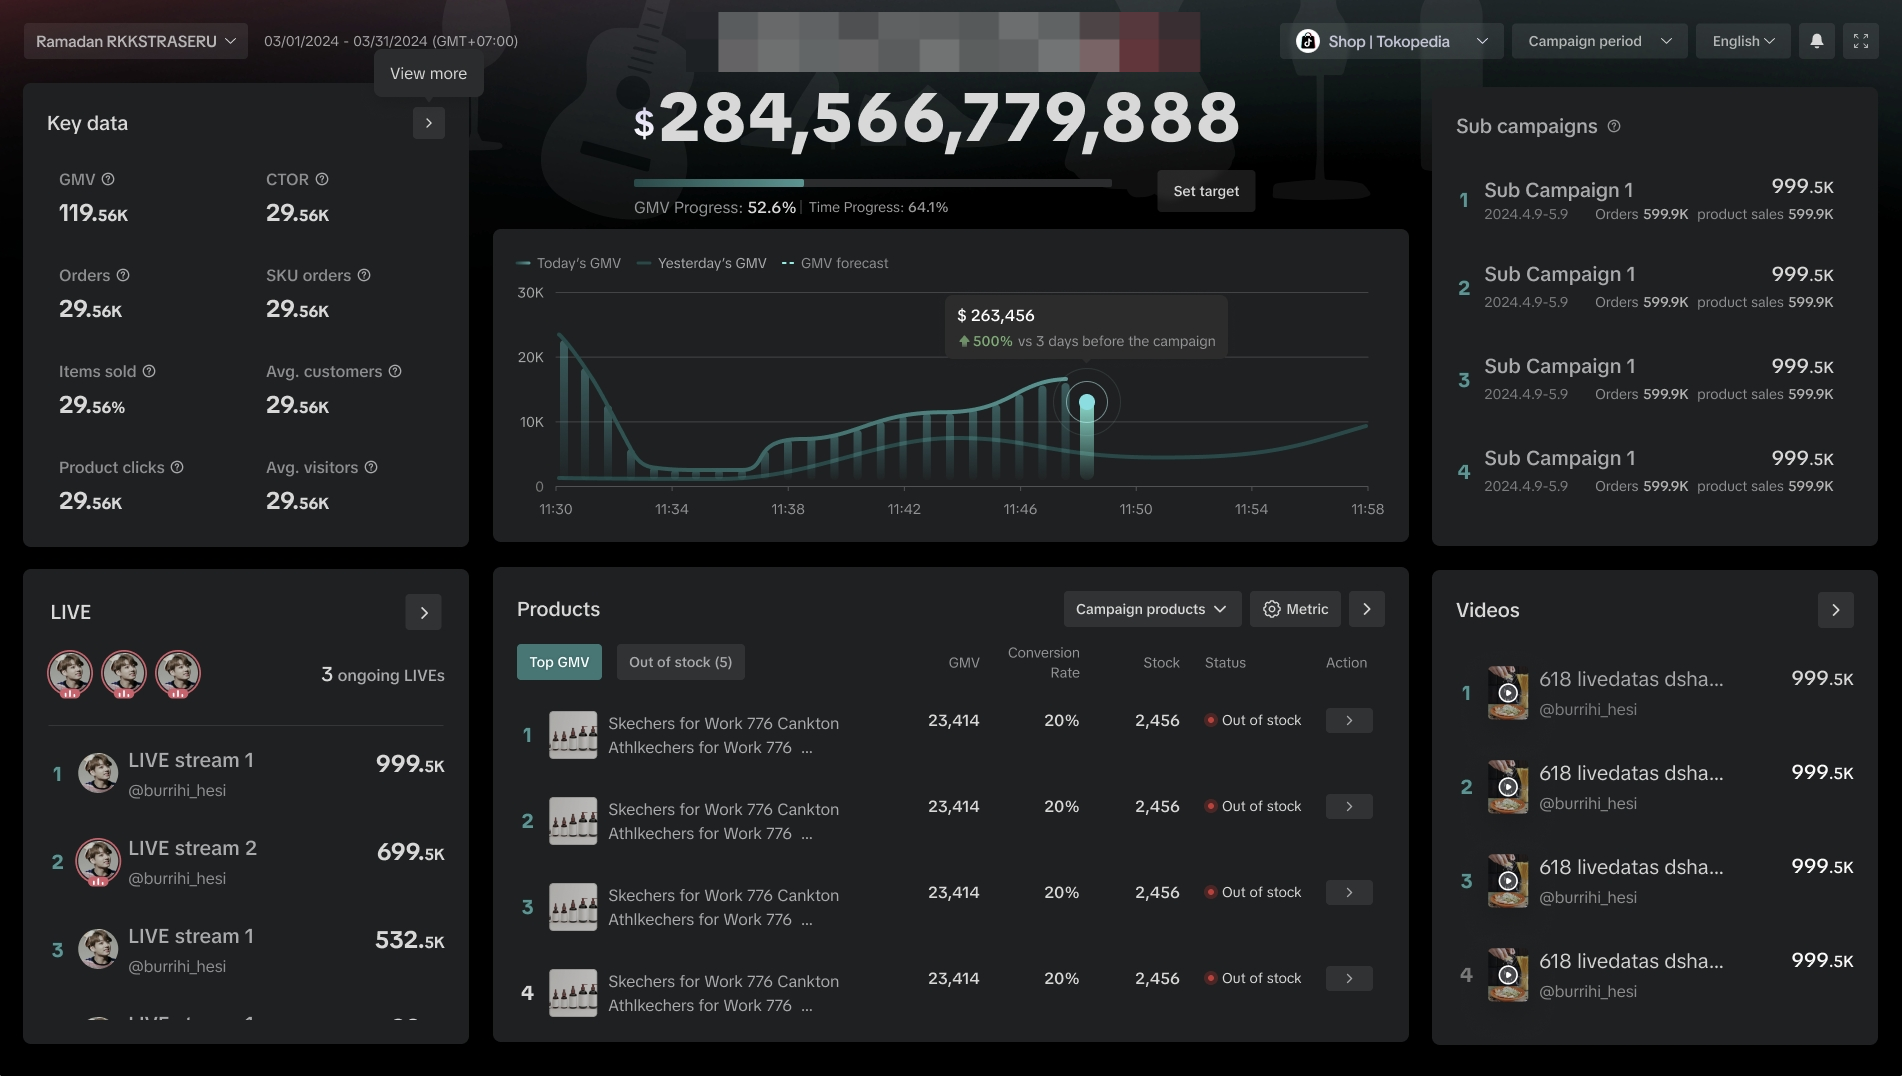


If you are unable to find the 2 entrance points shared above, you can also try these methods via Seller Center:
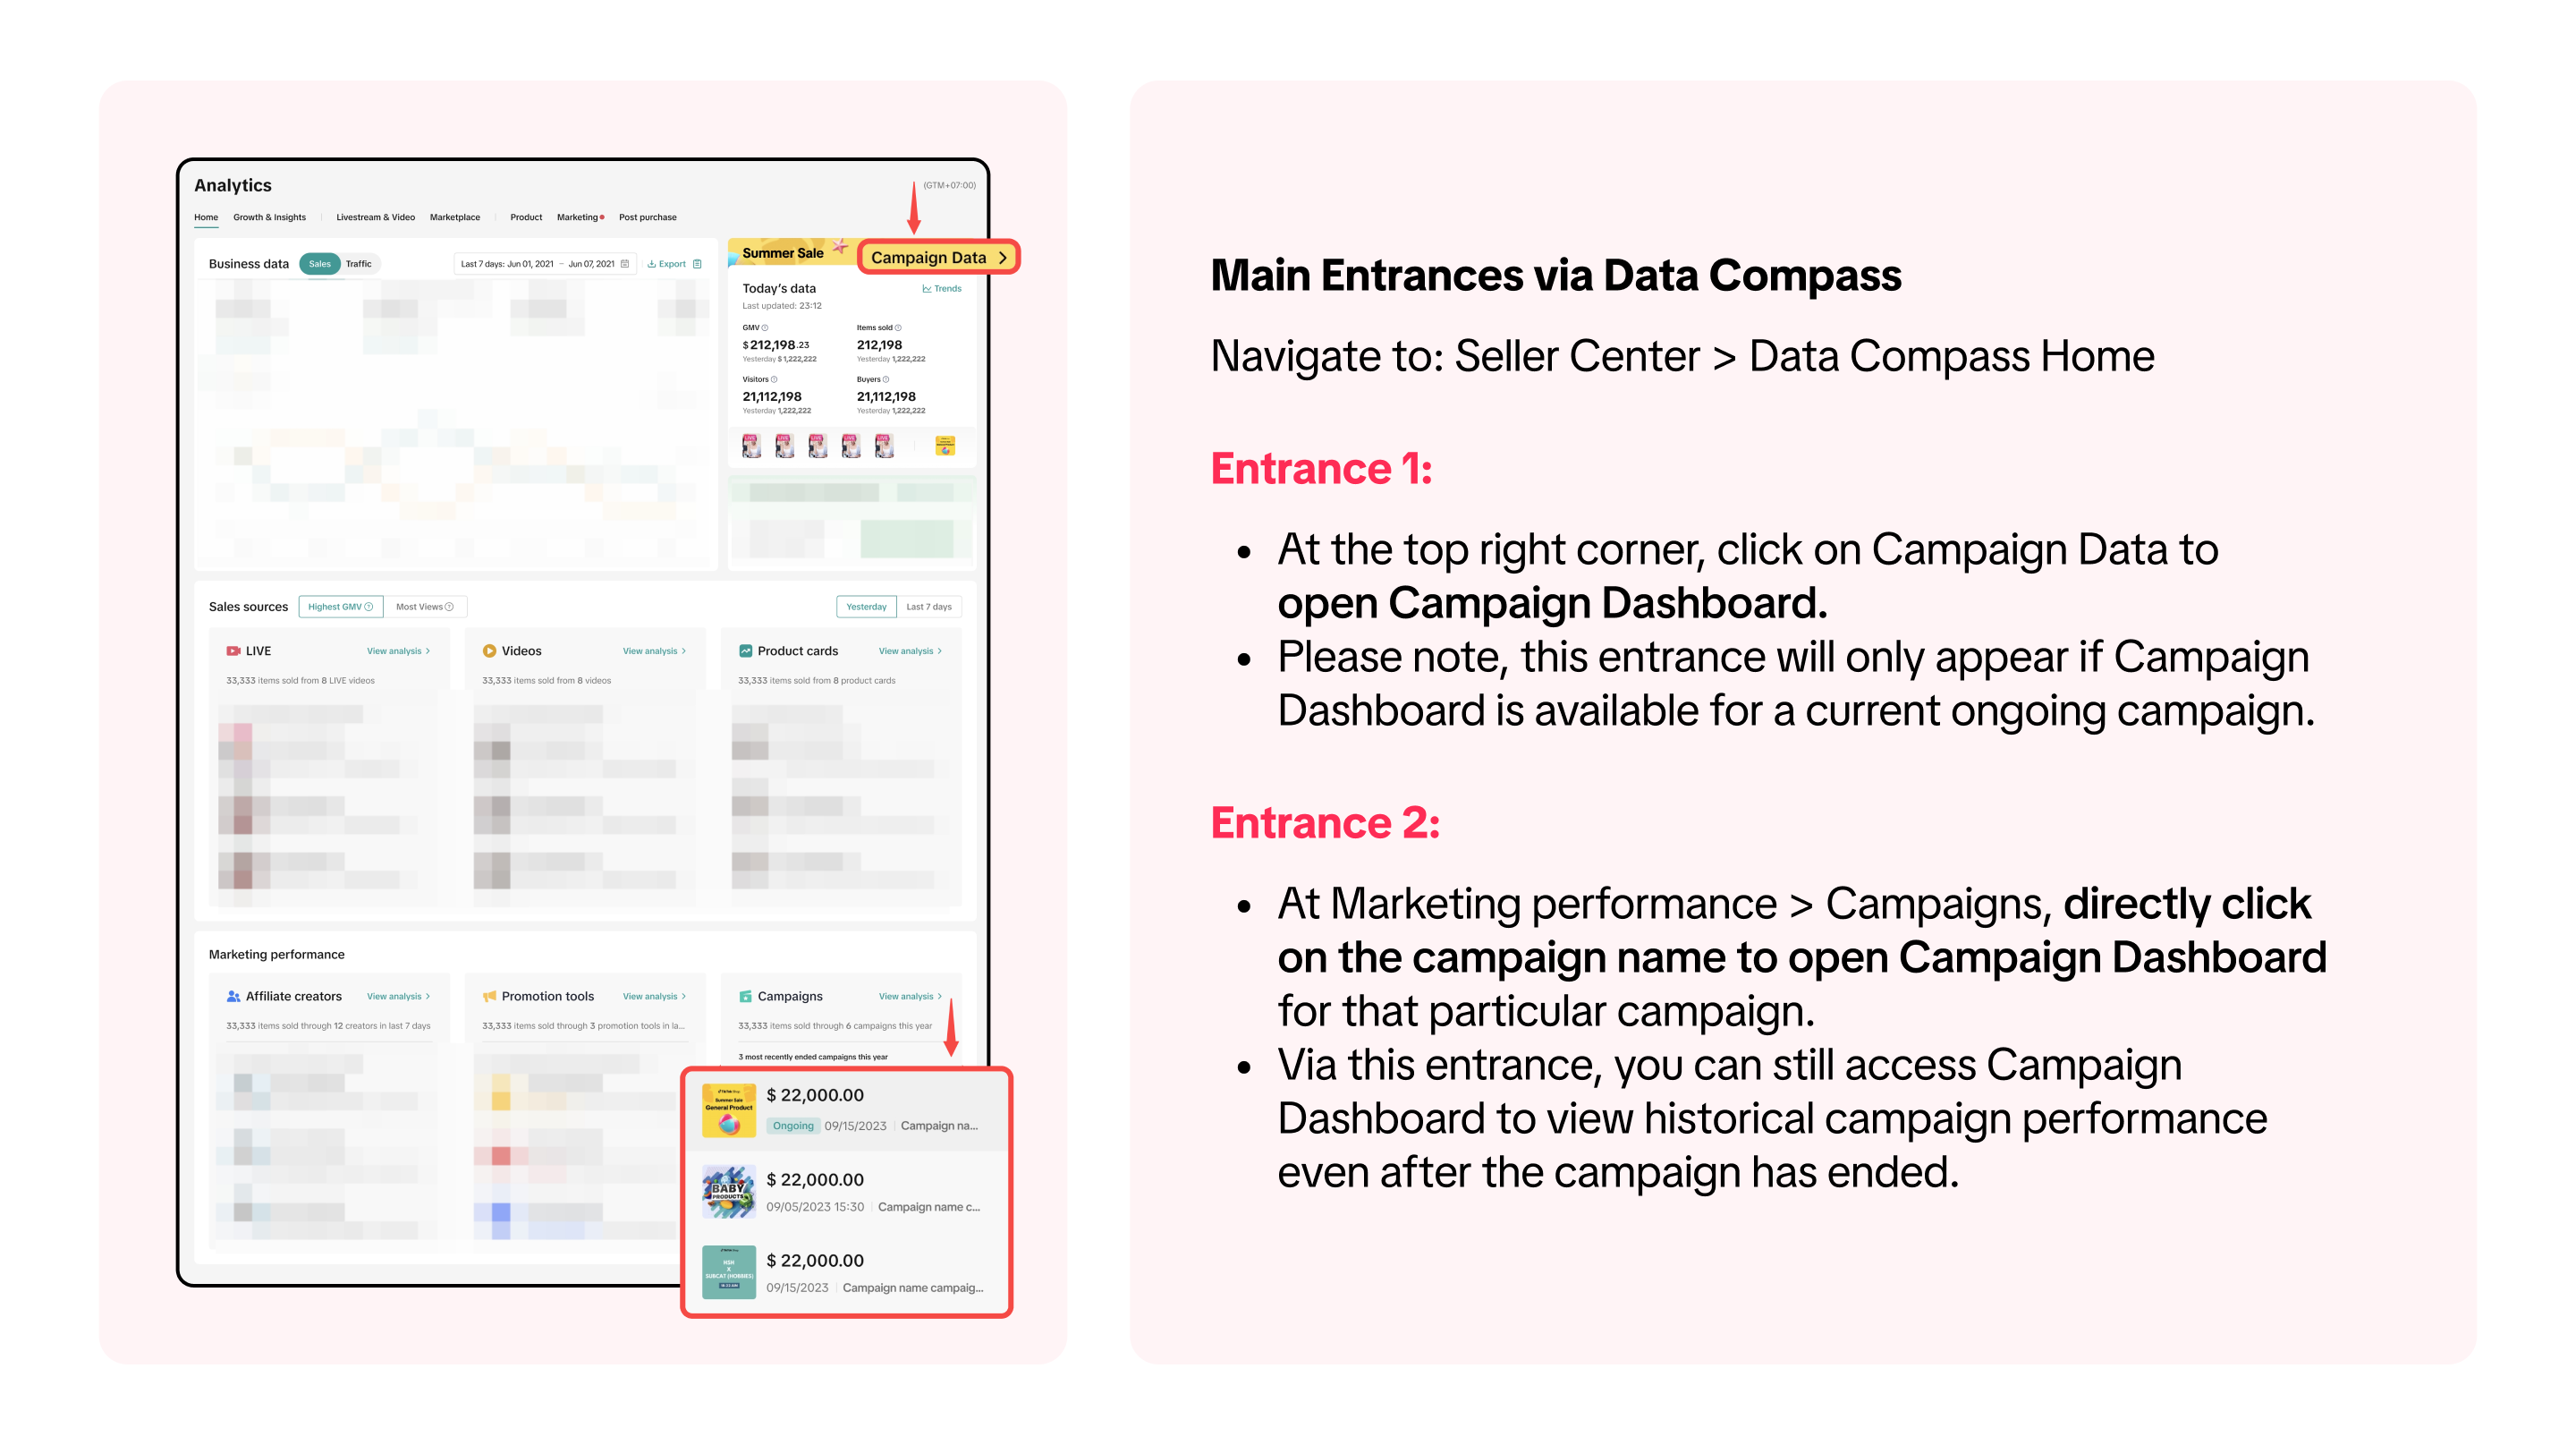
Where to Access Campaign Dashboard
Click Here to Go To Campaign Dashboard
How To Analyse Campaign Performance in Real Time
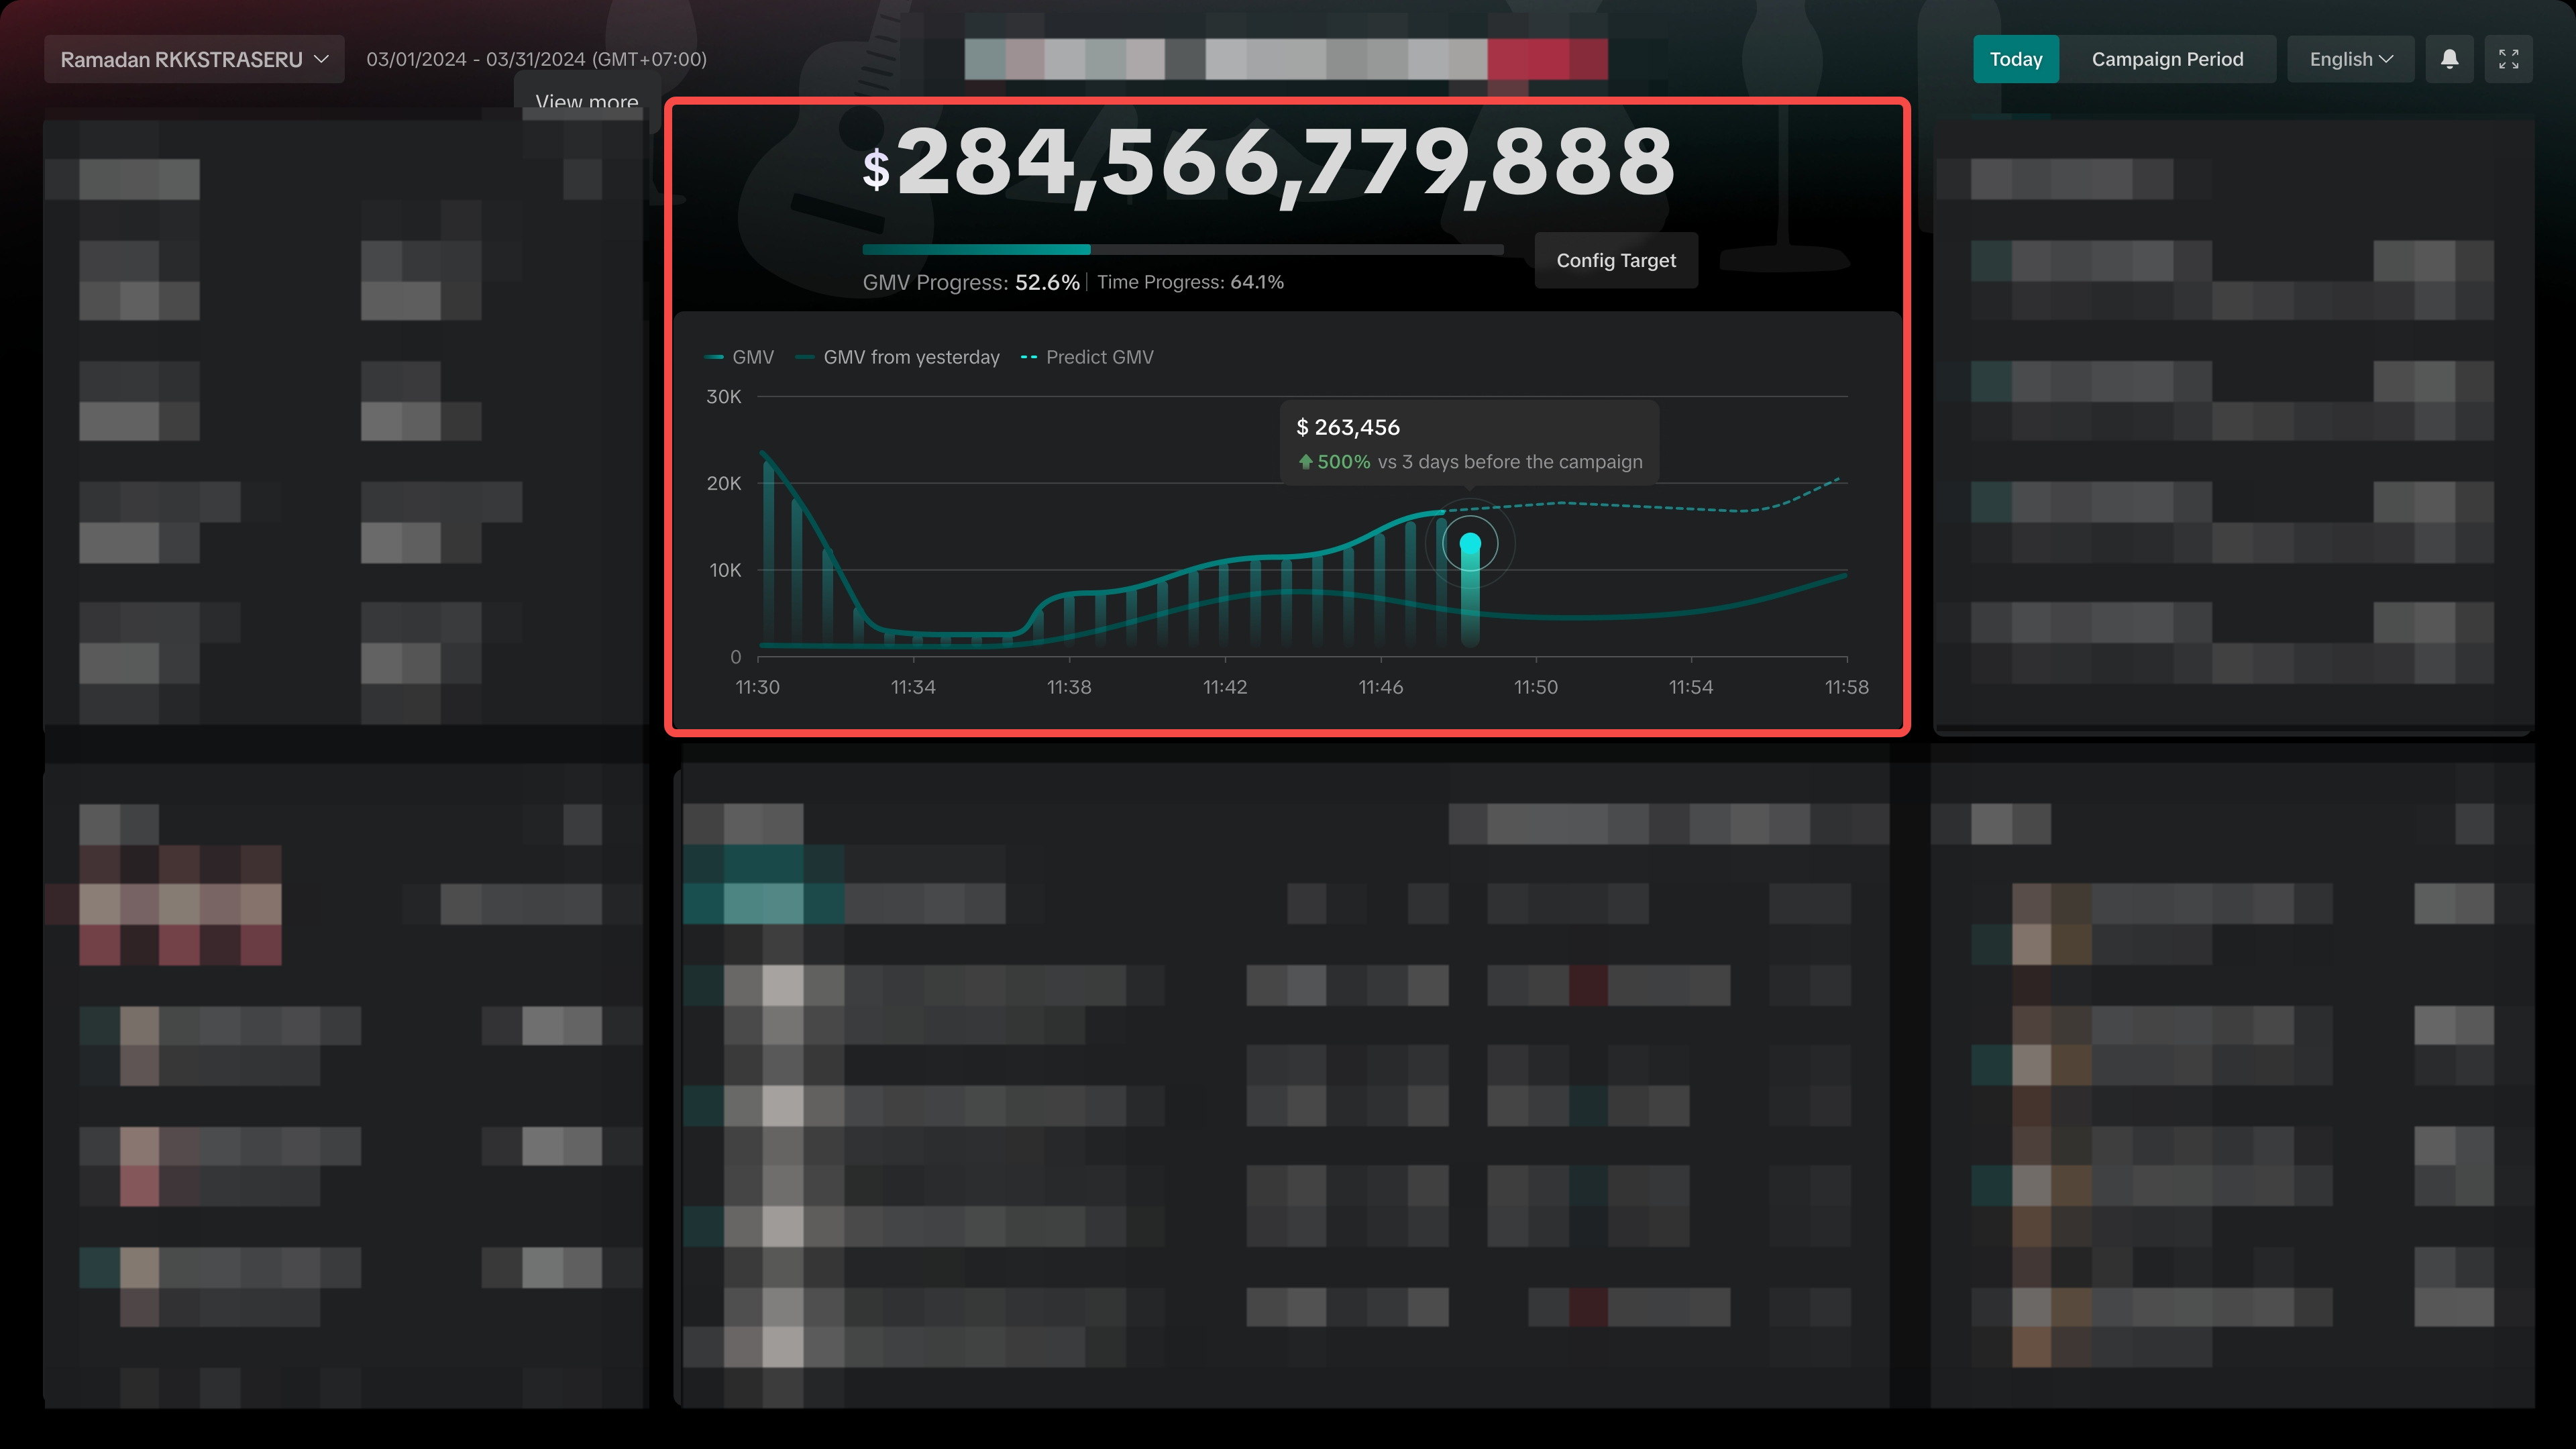
Track Your Campaign GMV Achievement and GMV Trend
Here, you can set your own campaign GMV target by clicking "Config Target", and monitor how your GMV performance is trending towards the target. If there are campaigns available on both ShopTokopedia and Tokopedia, the GMV target will apply to both.View your Core Data
Quickly grasp how your key metrics are performing during the campaign - such as GMV, Orders, Item Sold and more.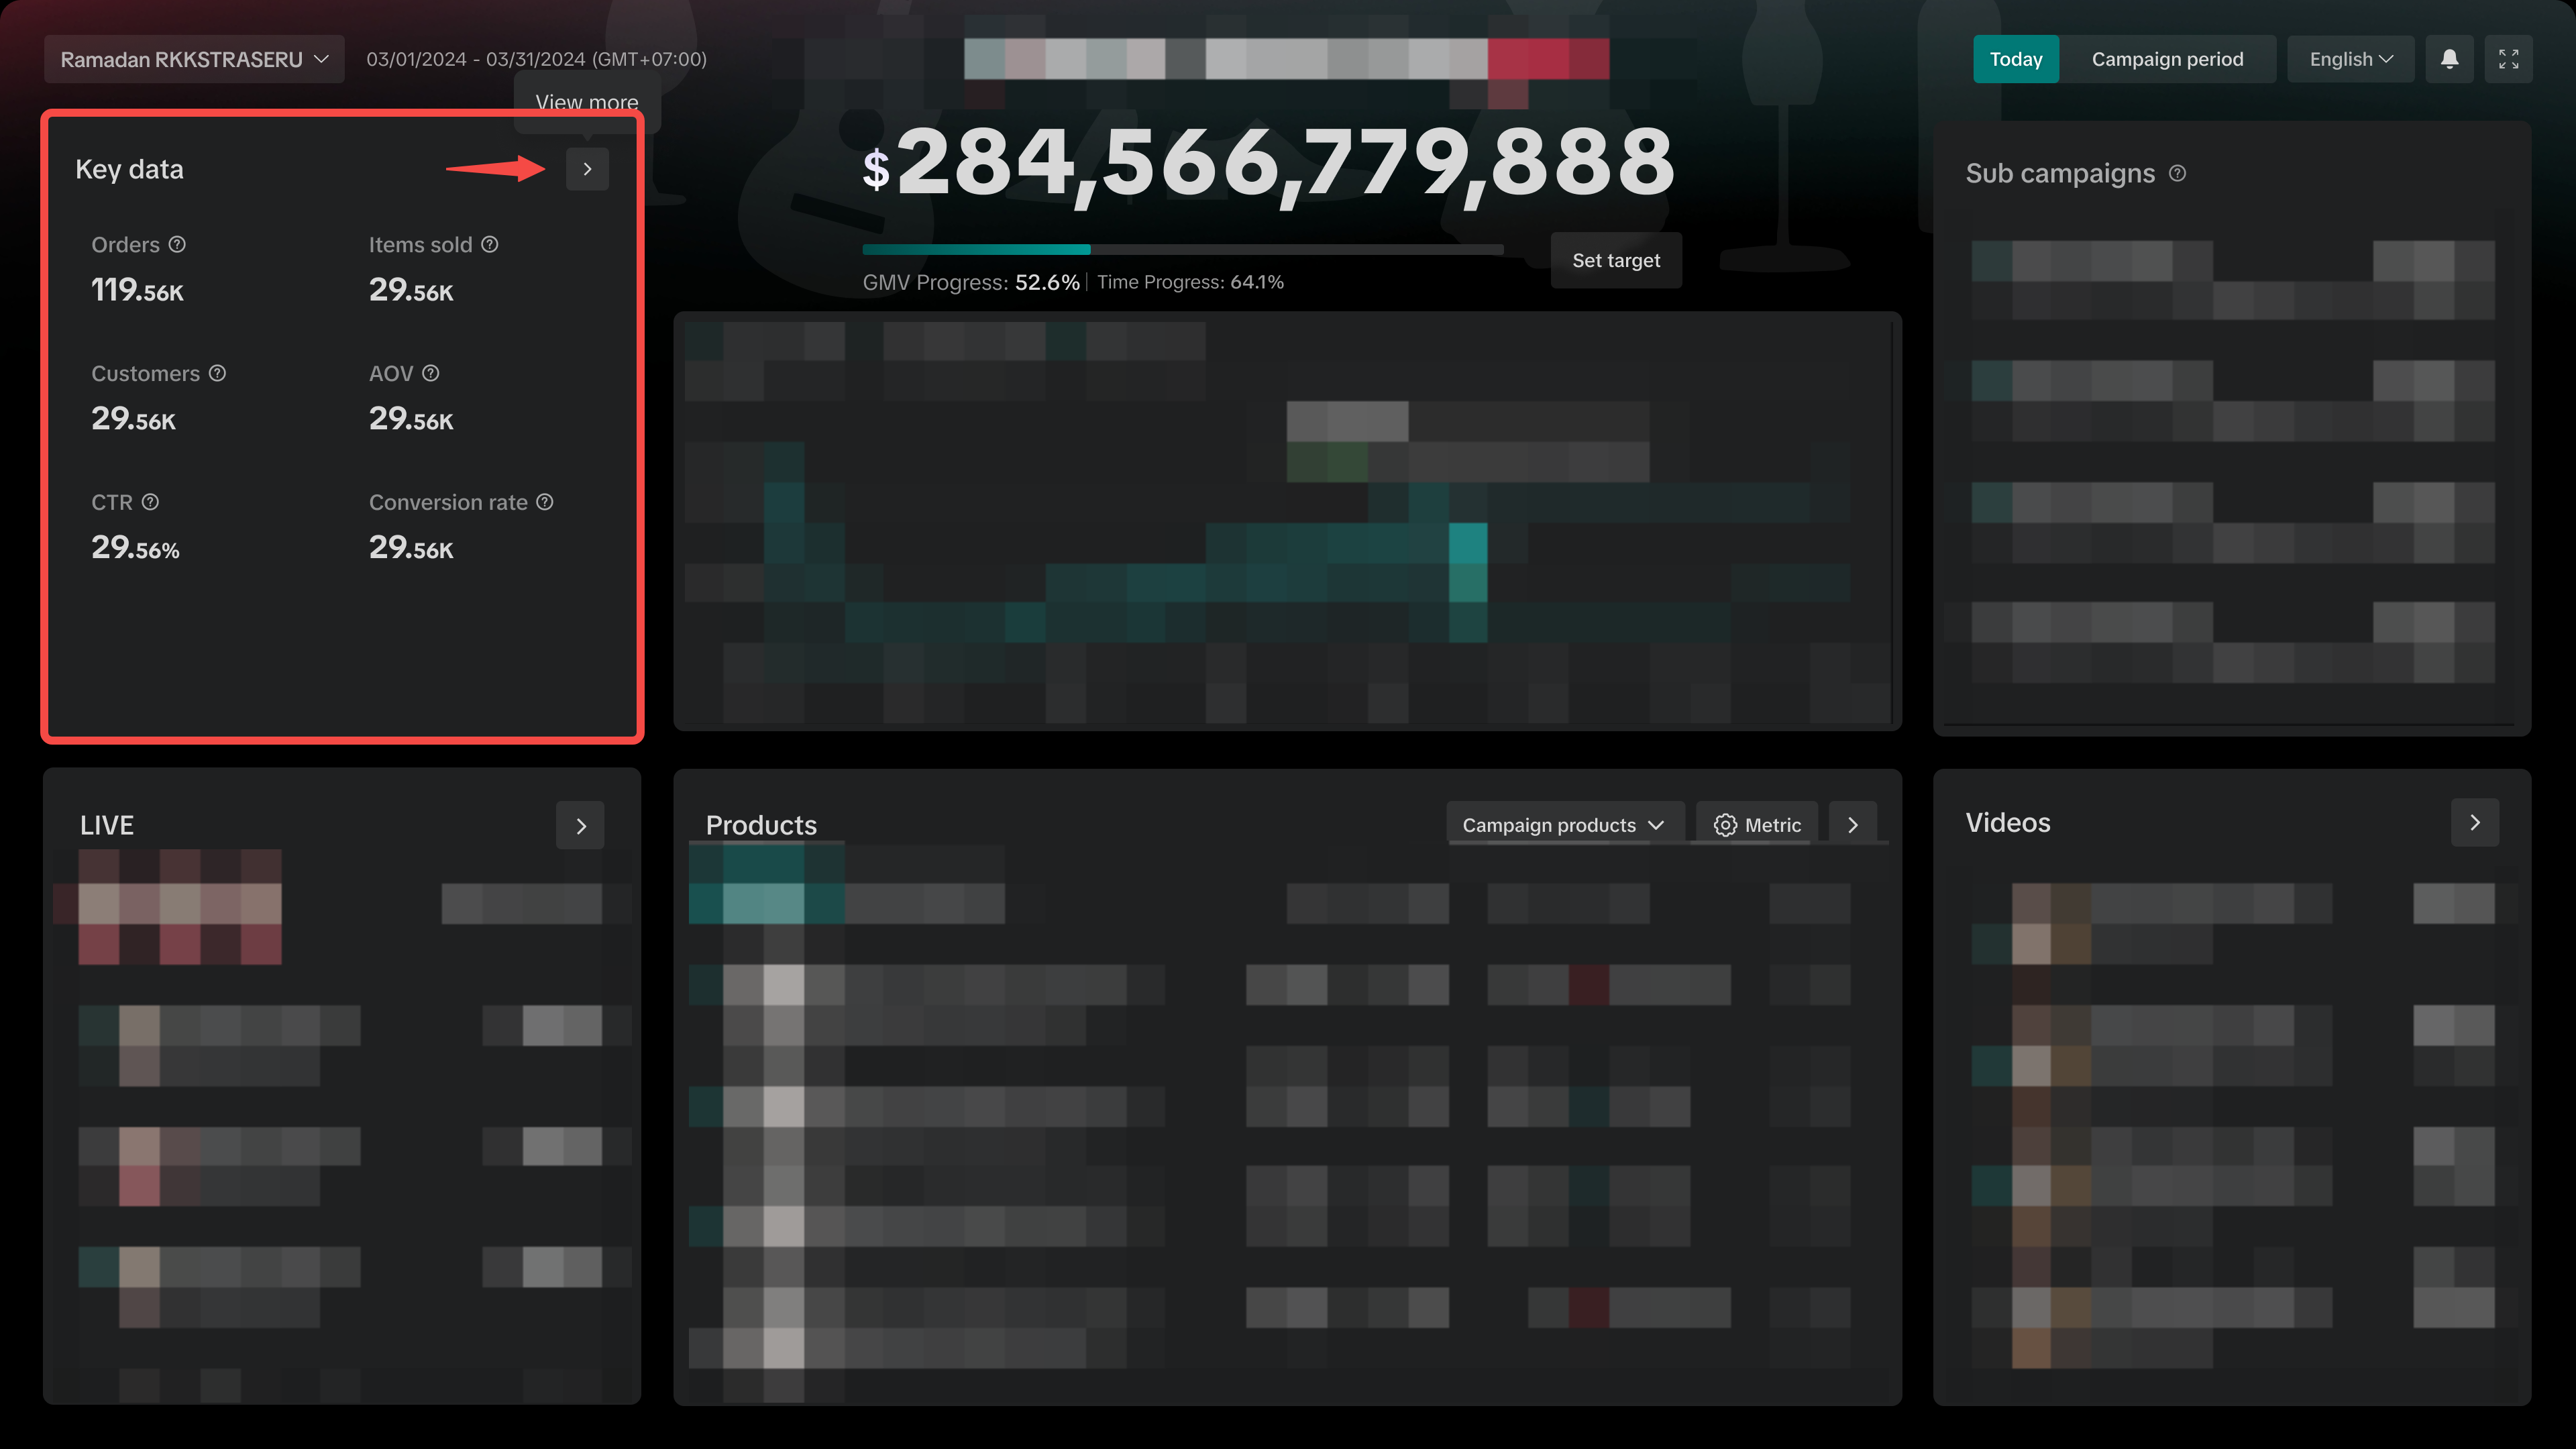 | 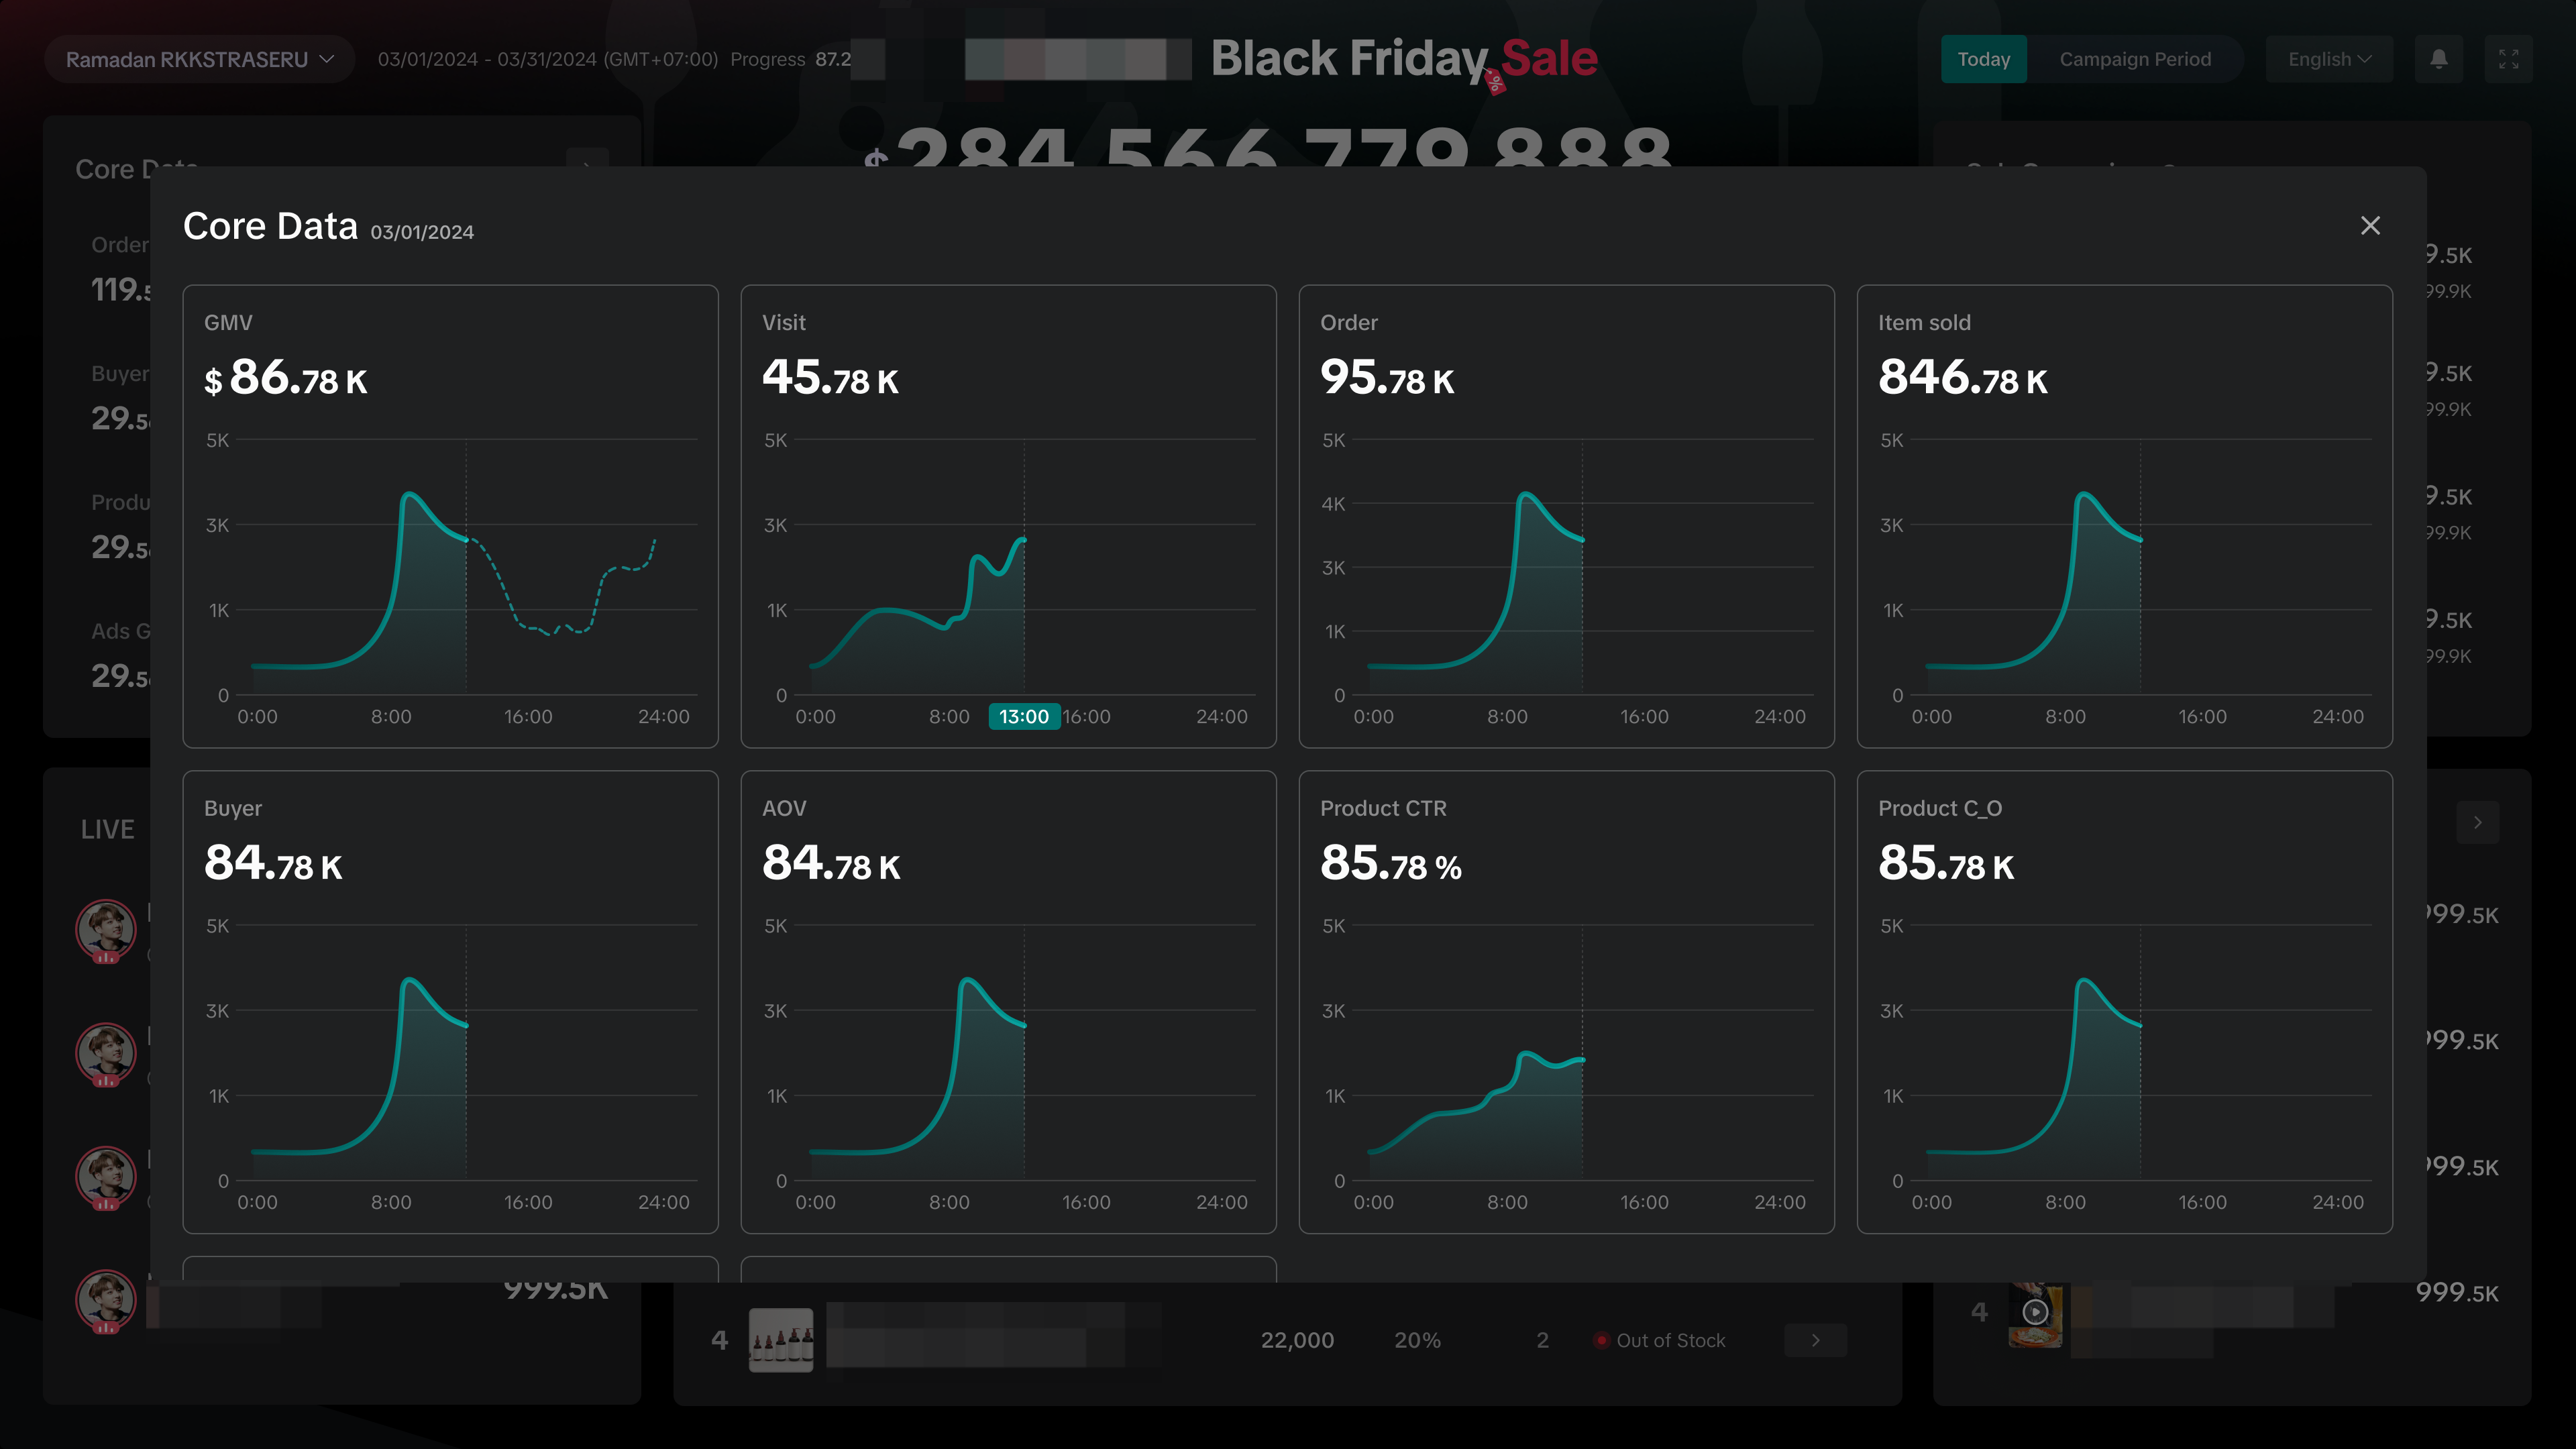 |
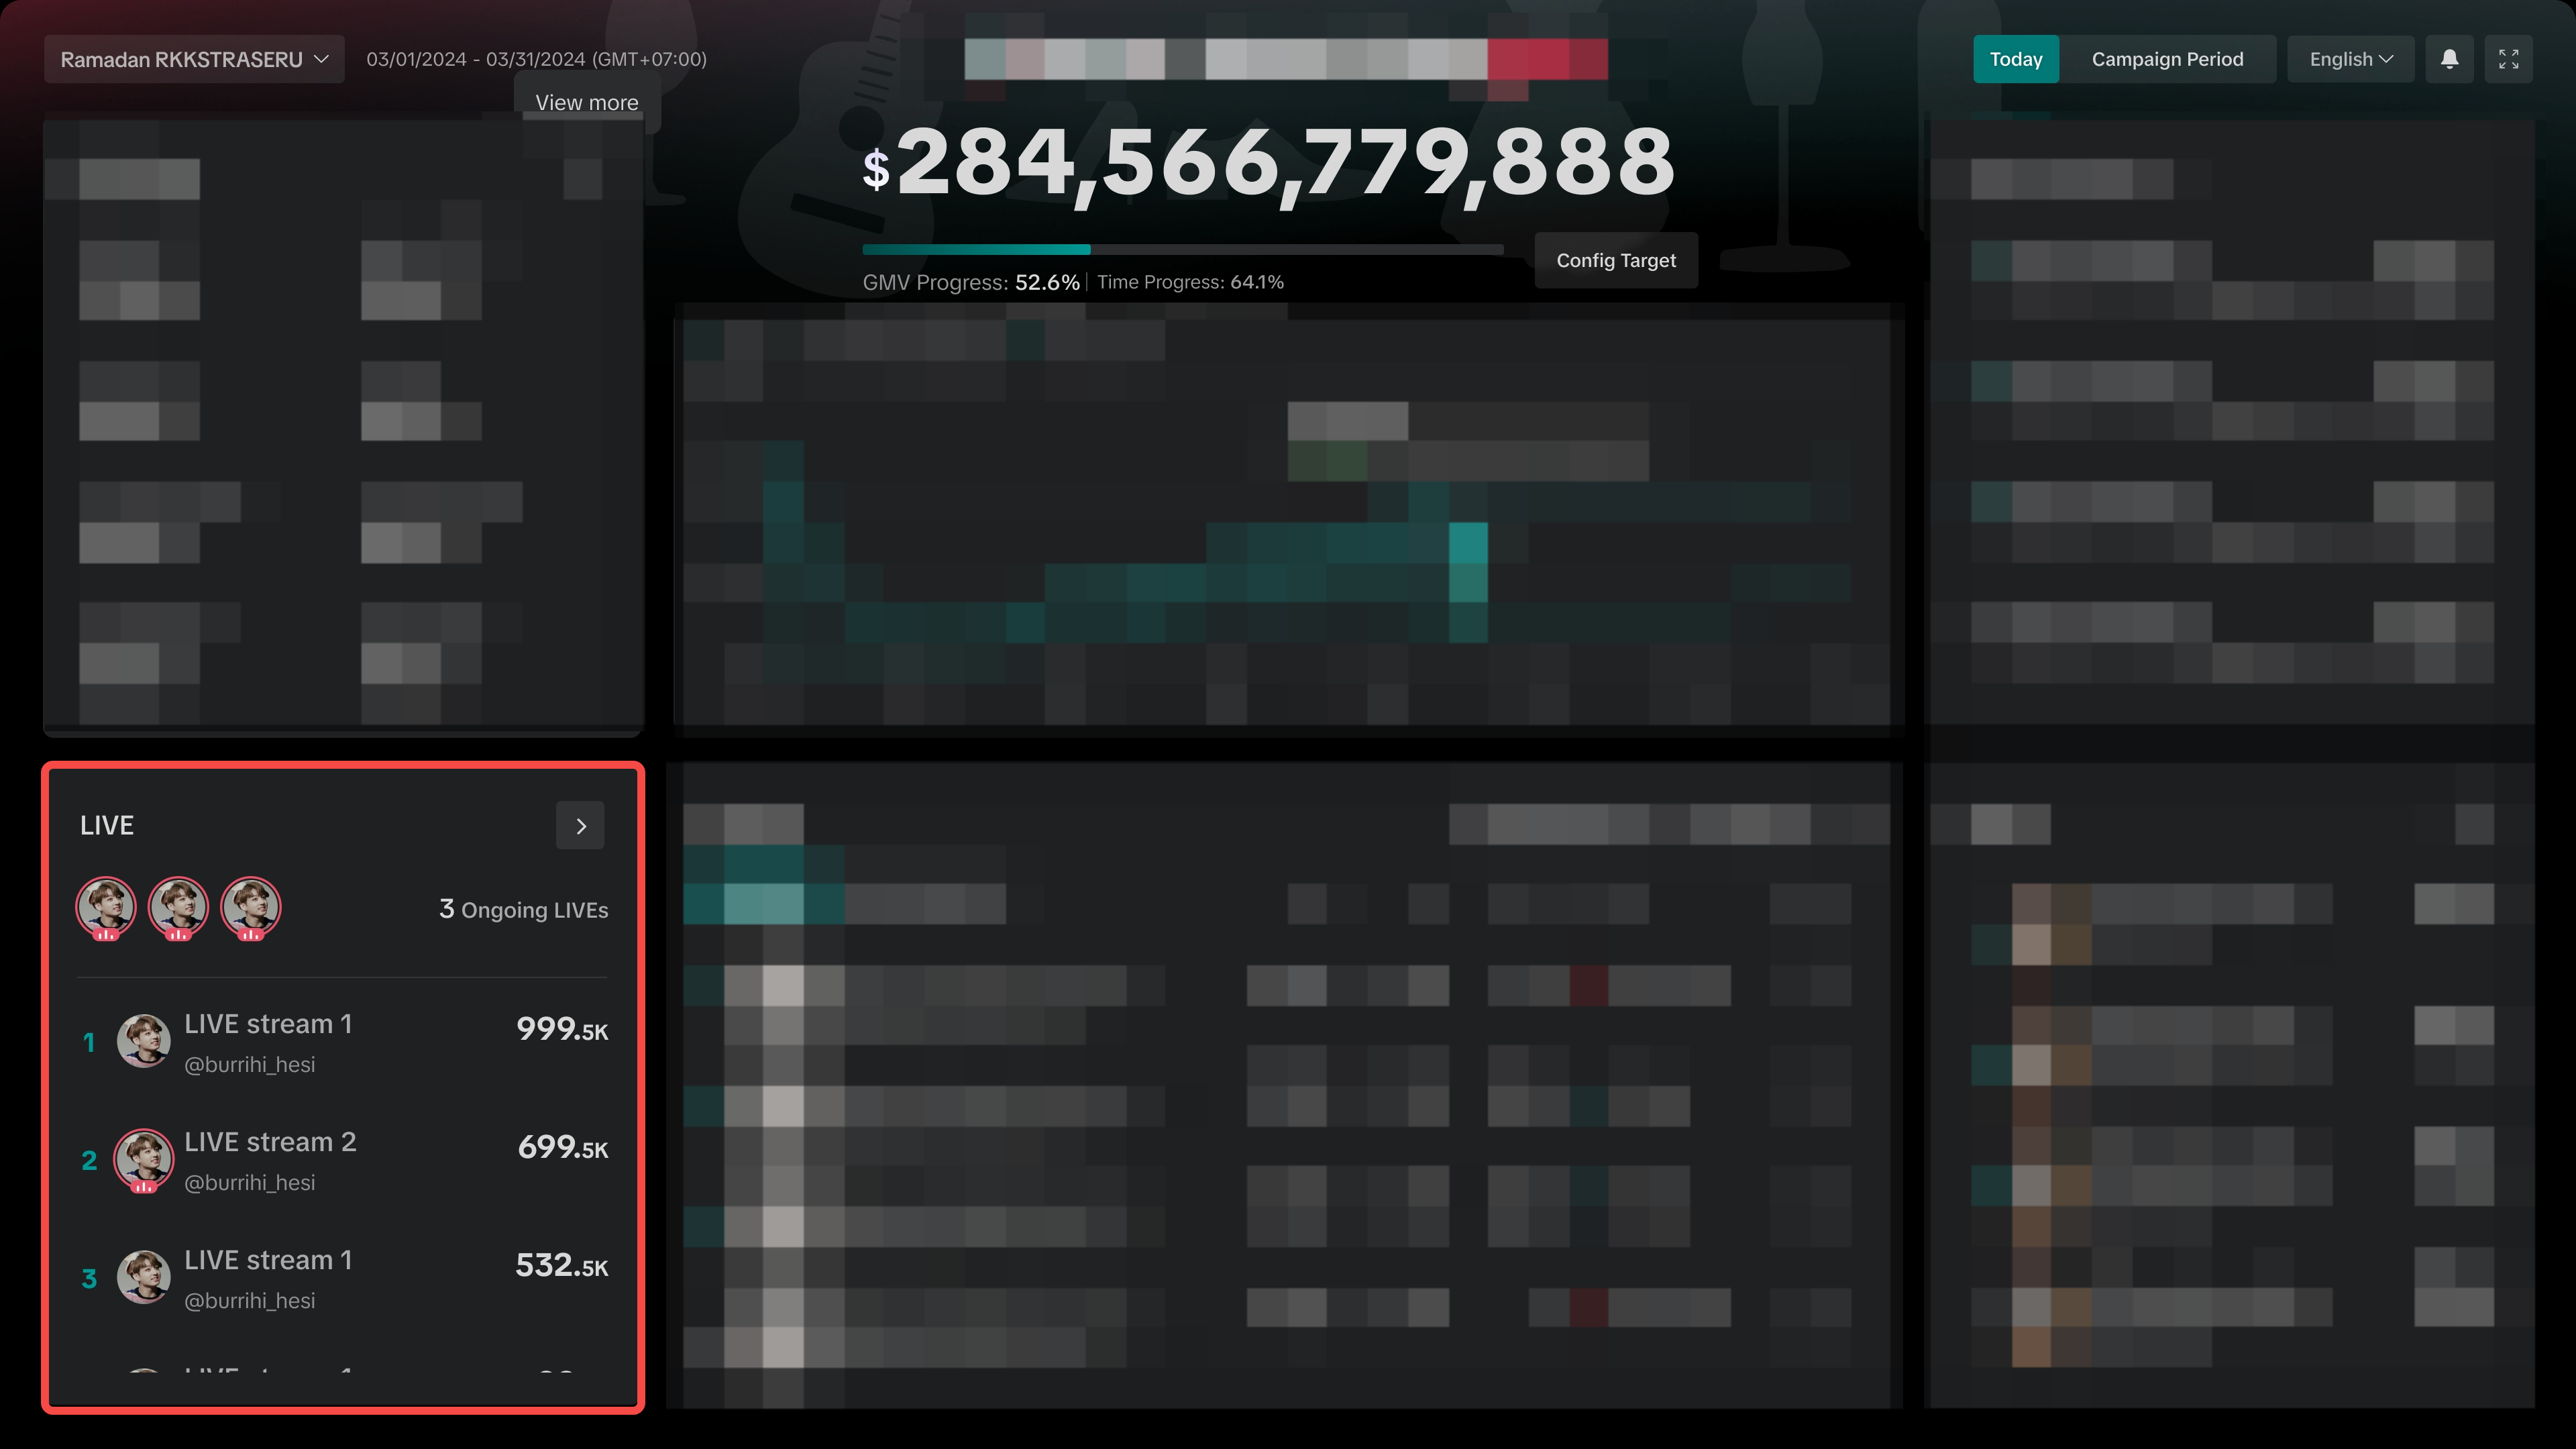
Review Performance of LIVEs
Directly access ongoing Livestreams by clicking on the creator bubble, and quickly view the list of top performing LIVEs ranked from highest to lowest GMV. Click on the arrow to access the full list of LIVEs. Currently, this section is only available for ShopTokopedia campaigns.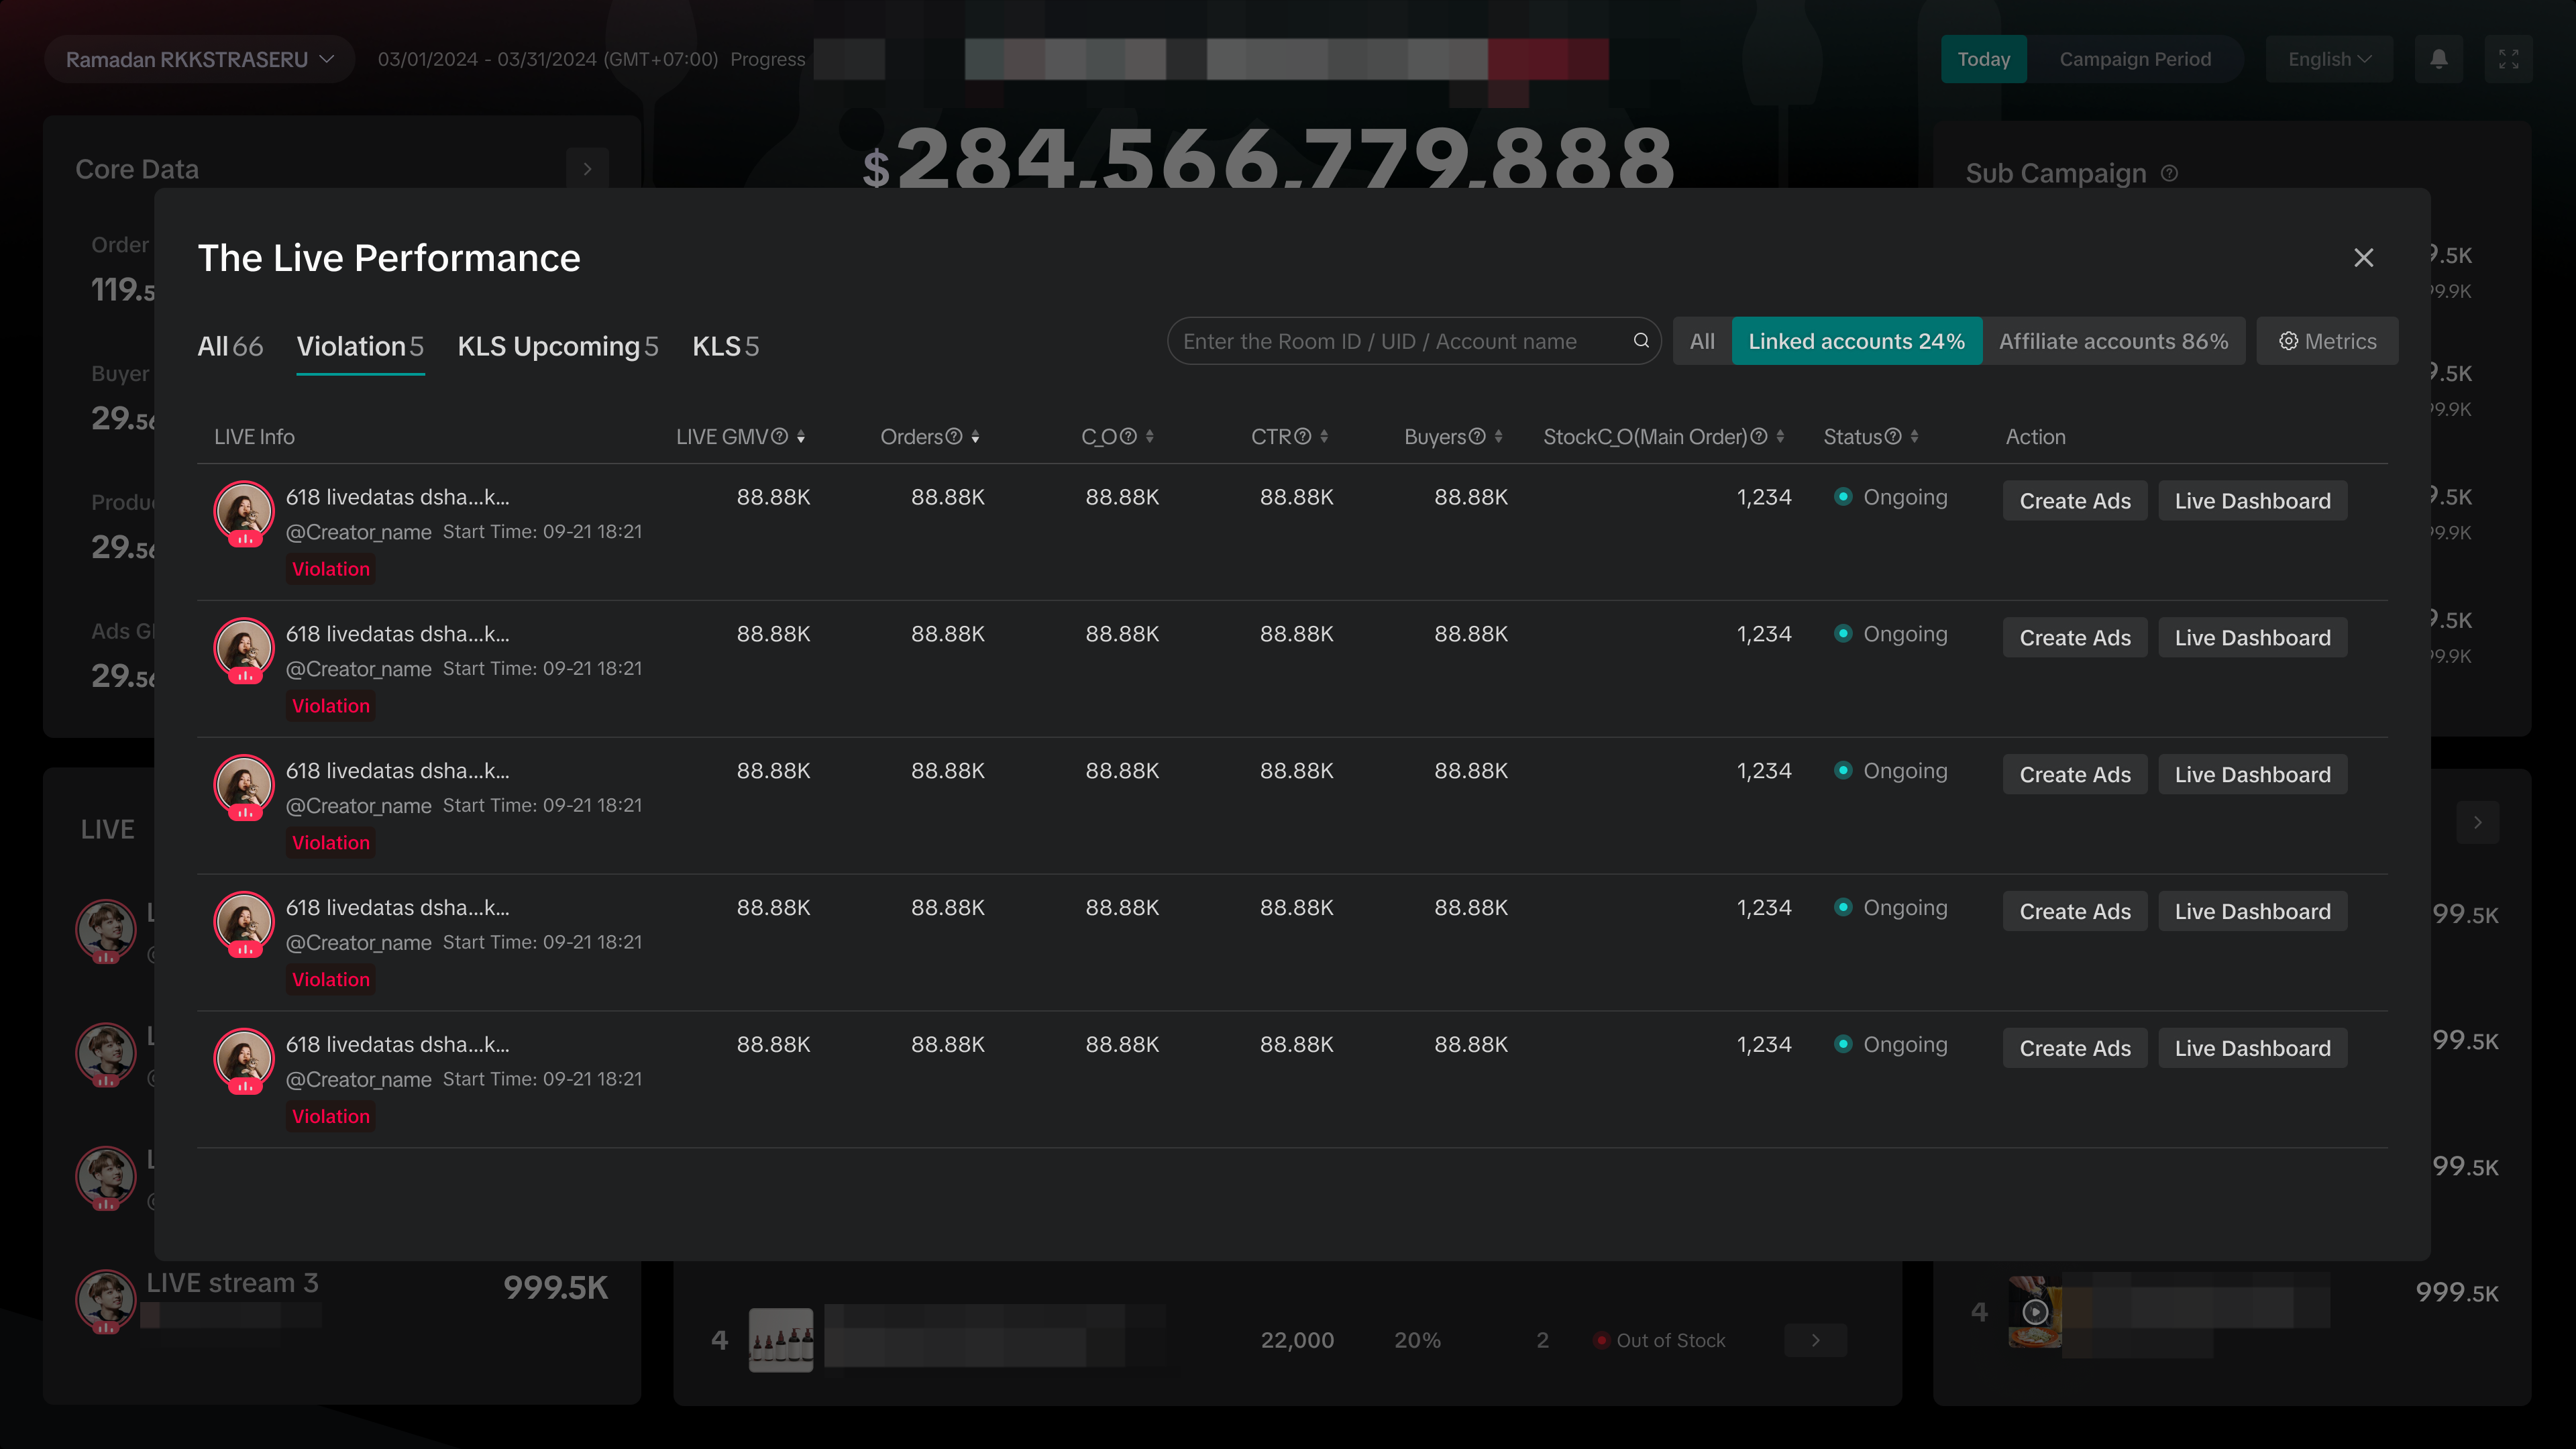 | The Live Performance list enables you to:
|
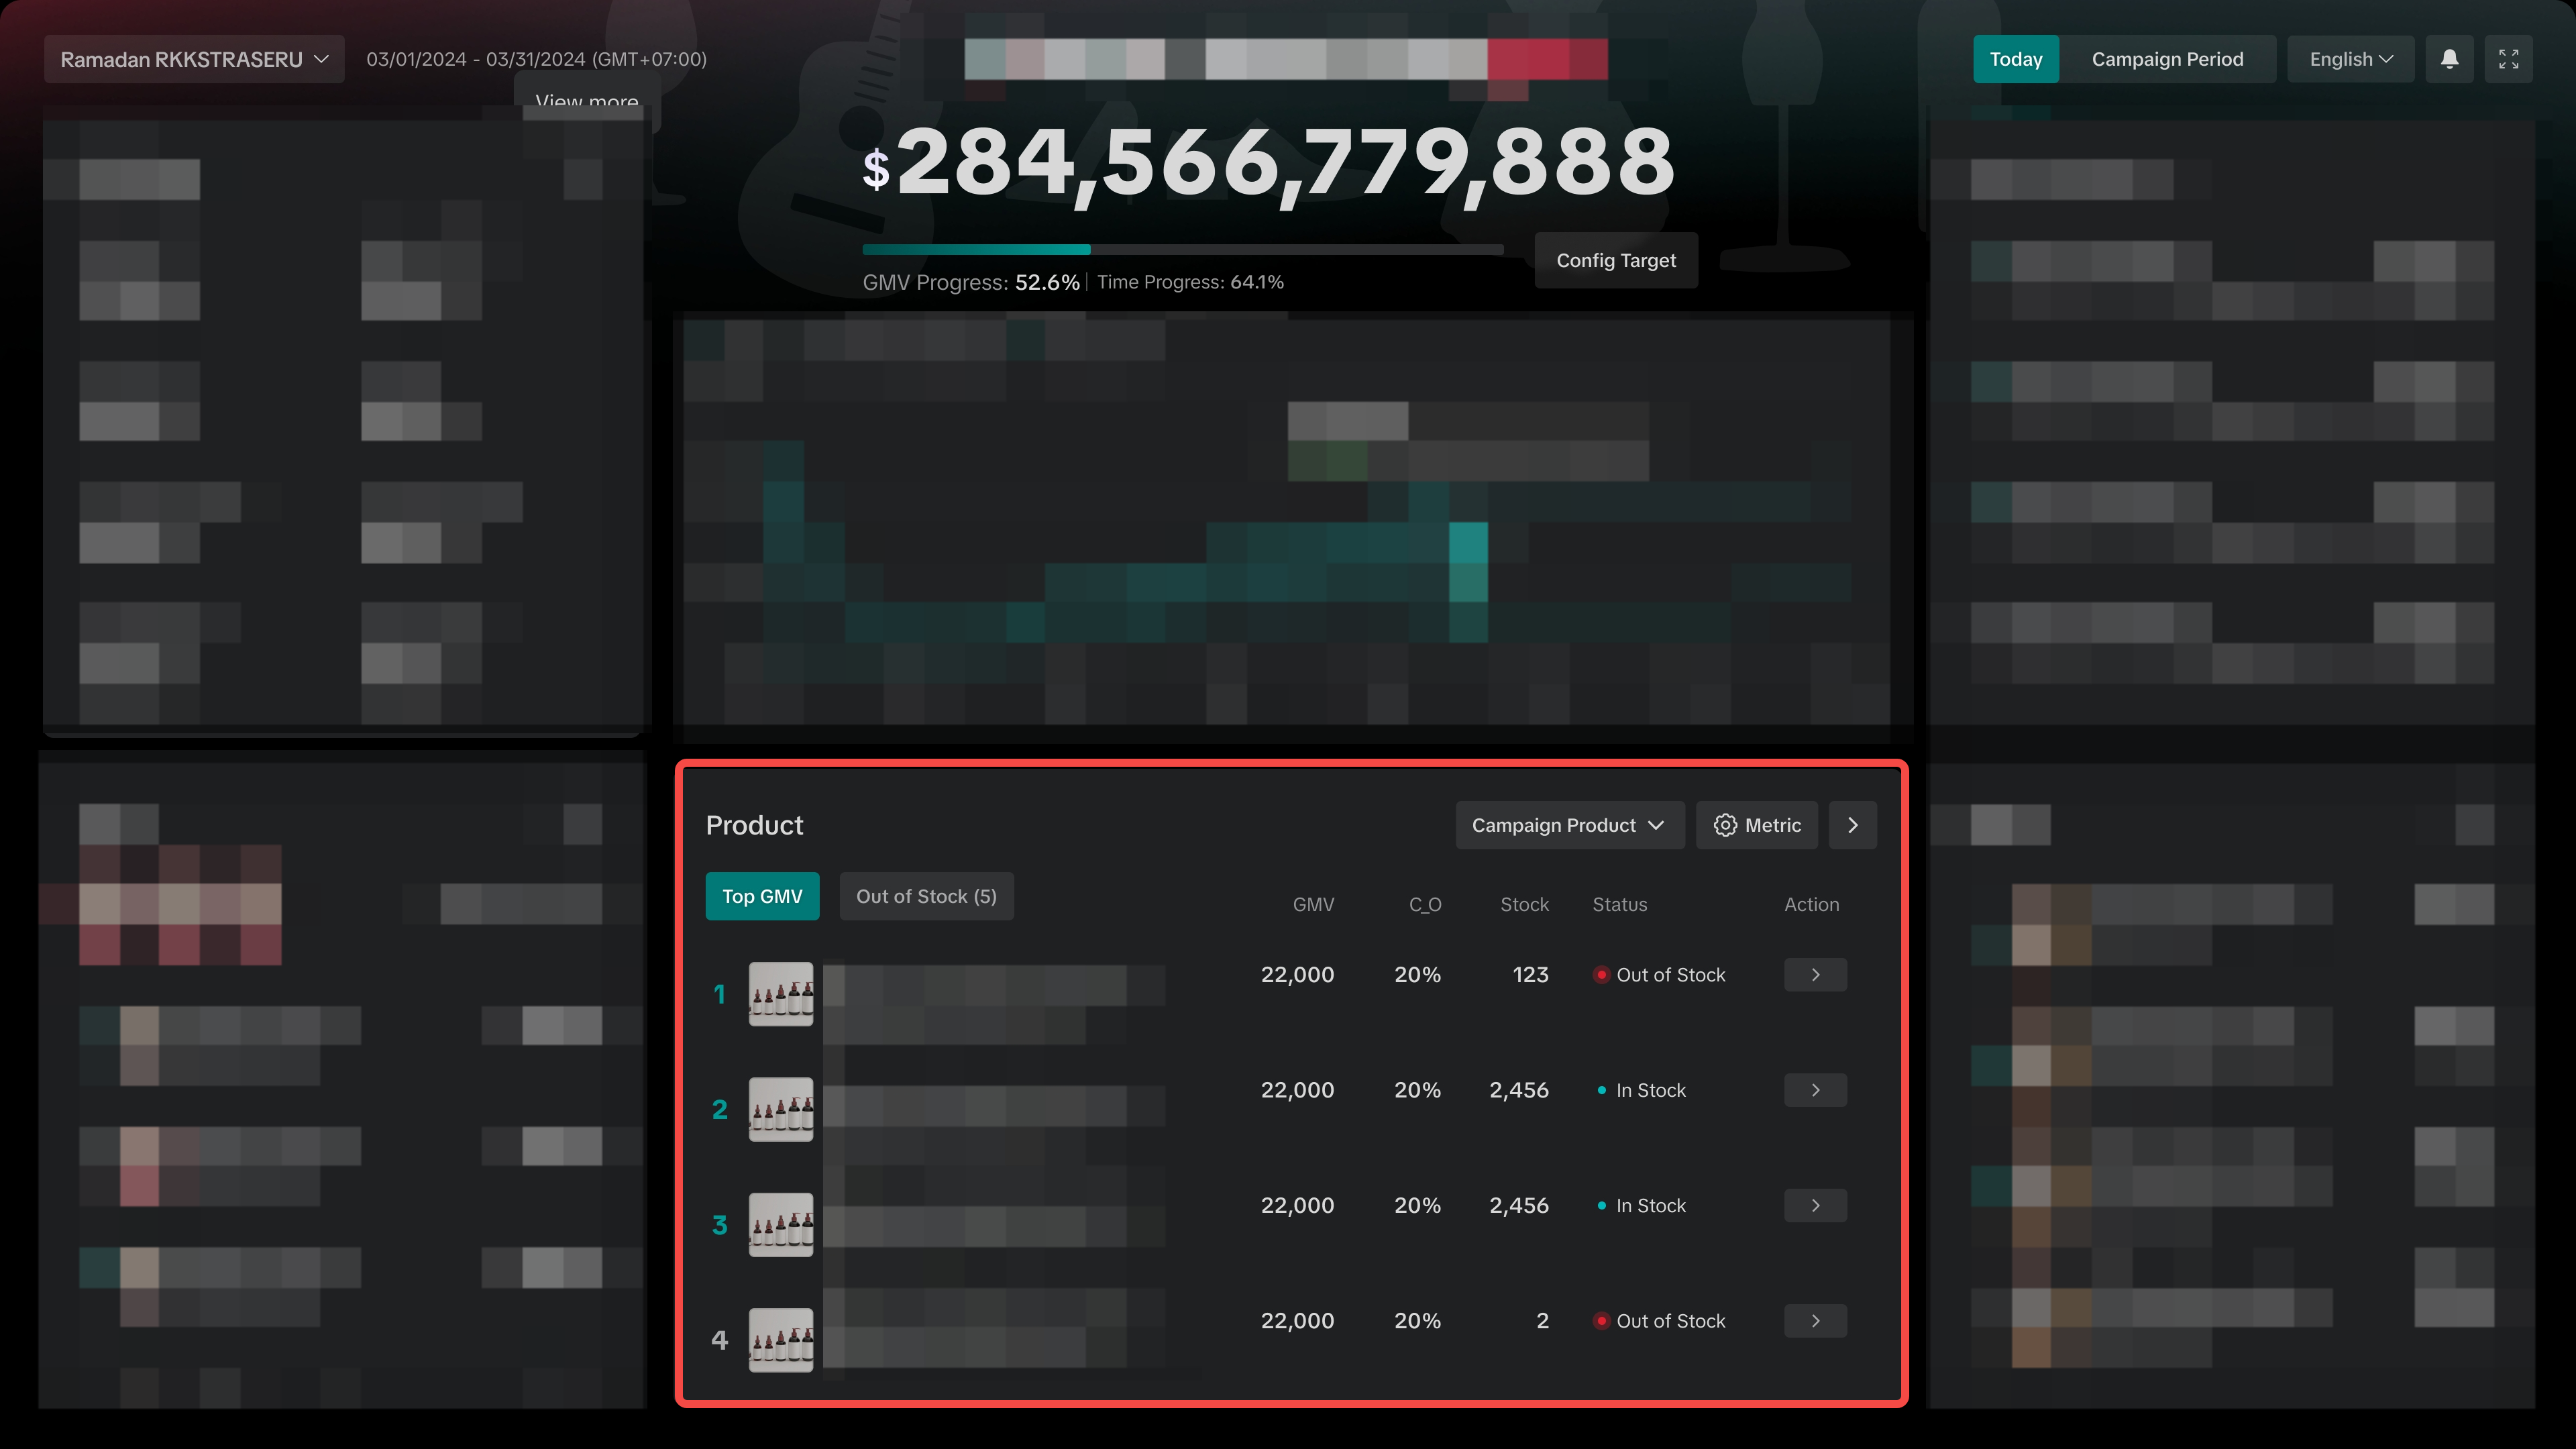
Track your Product Sales Performance
Identify fast-selling or slow-moving products to see where you can optimise further. Plus, easily recognise items that are out of stock to replenish inventory. Click on the arrow to access the full list of product performance.Product performance can be viewed in 2 different settings, either by product list view or by trendline view. | |
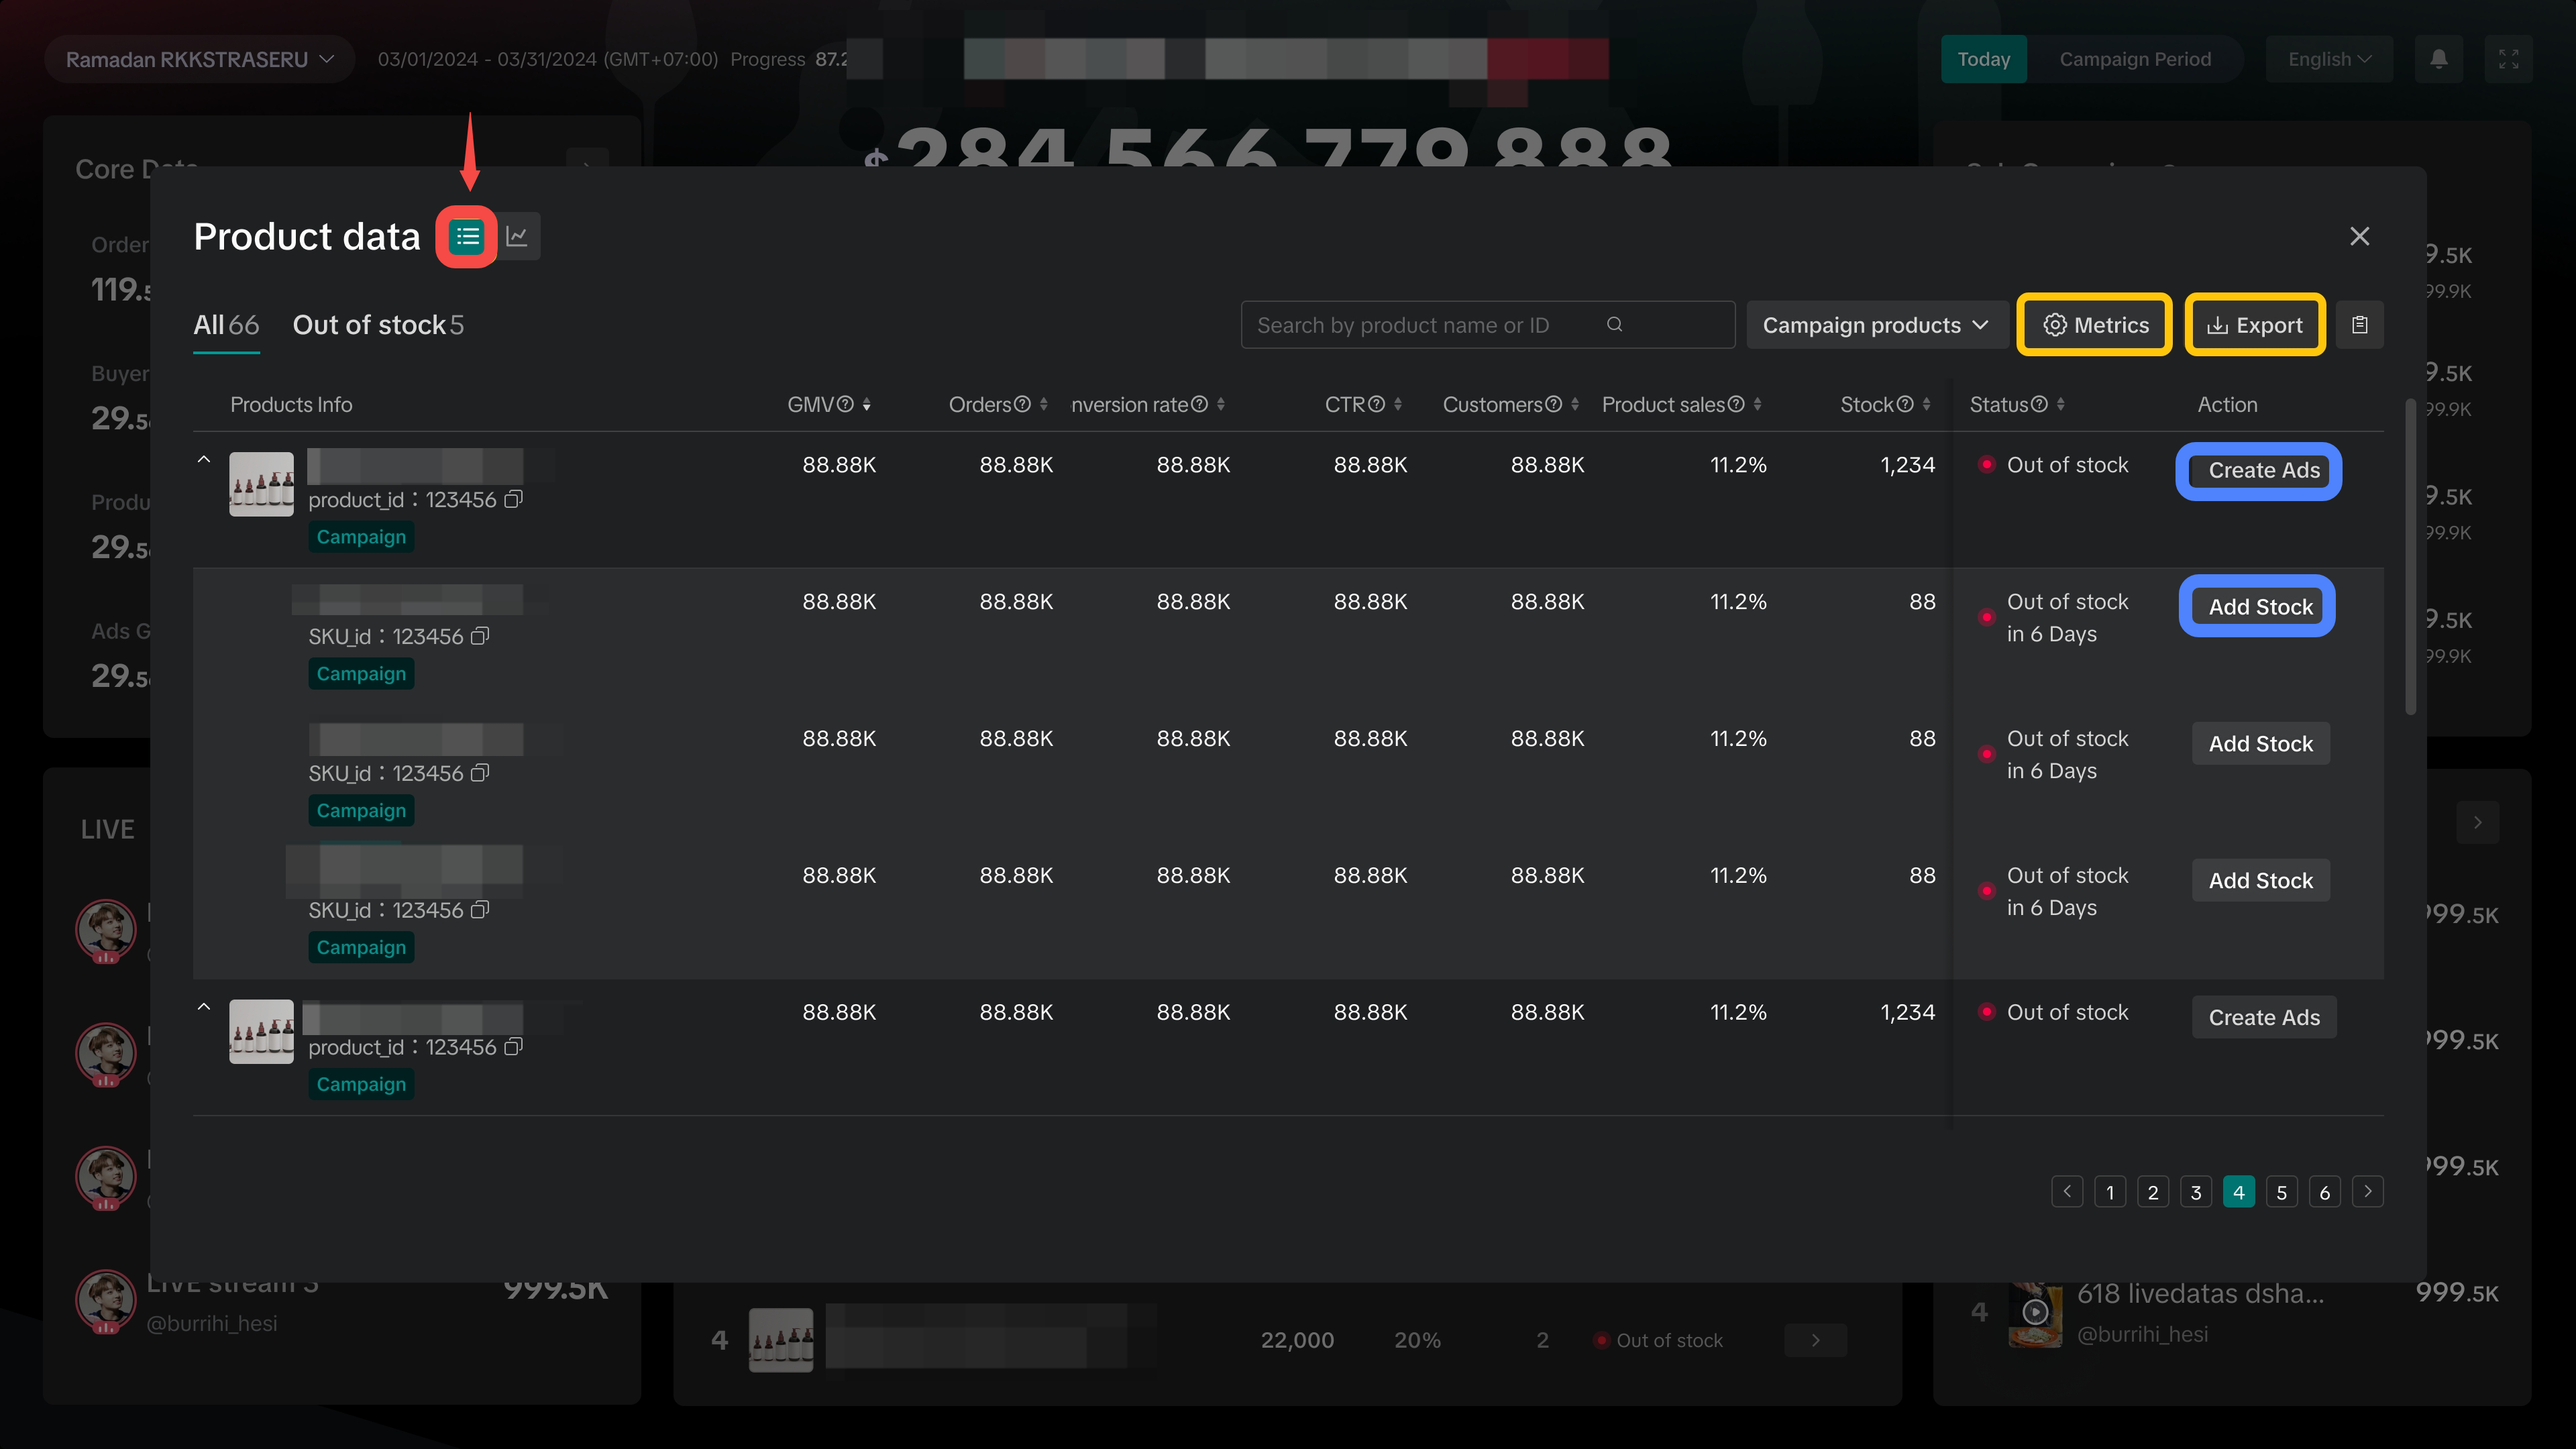
| 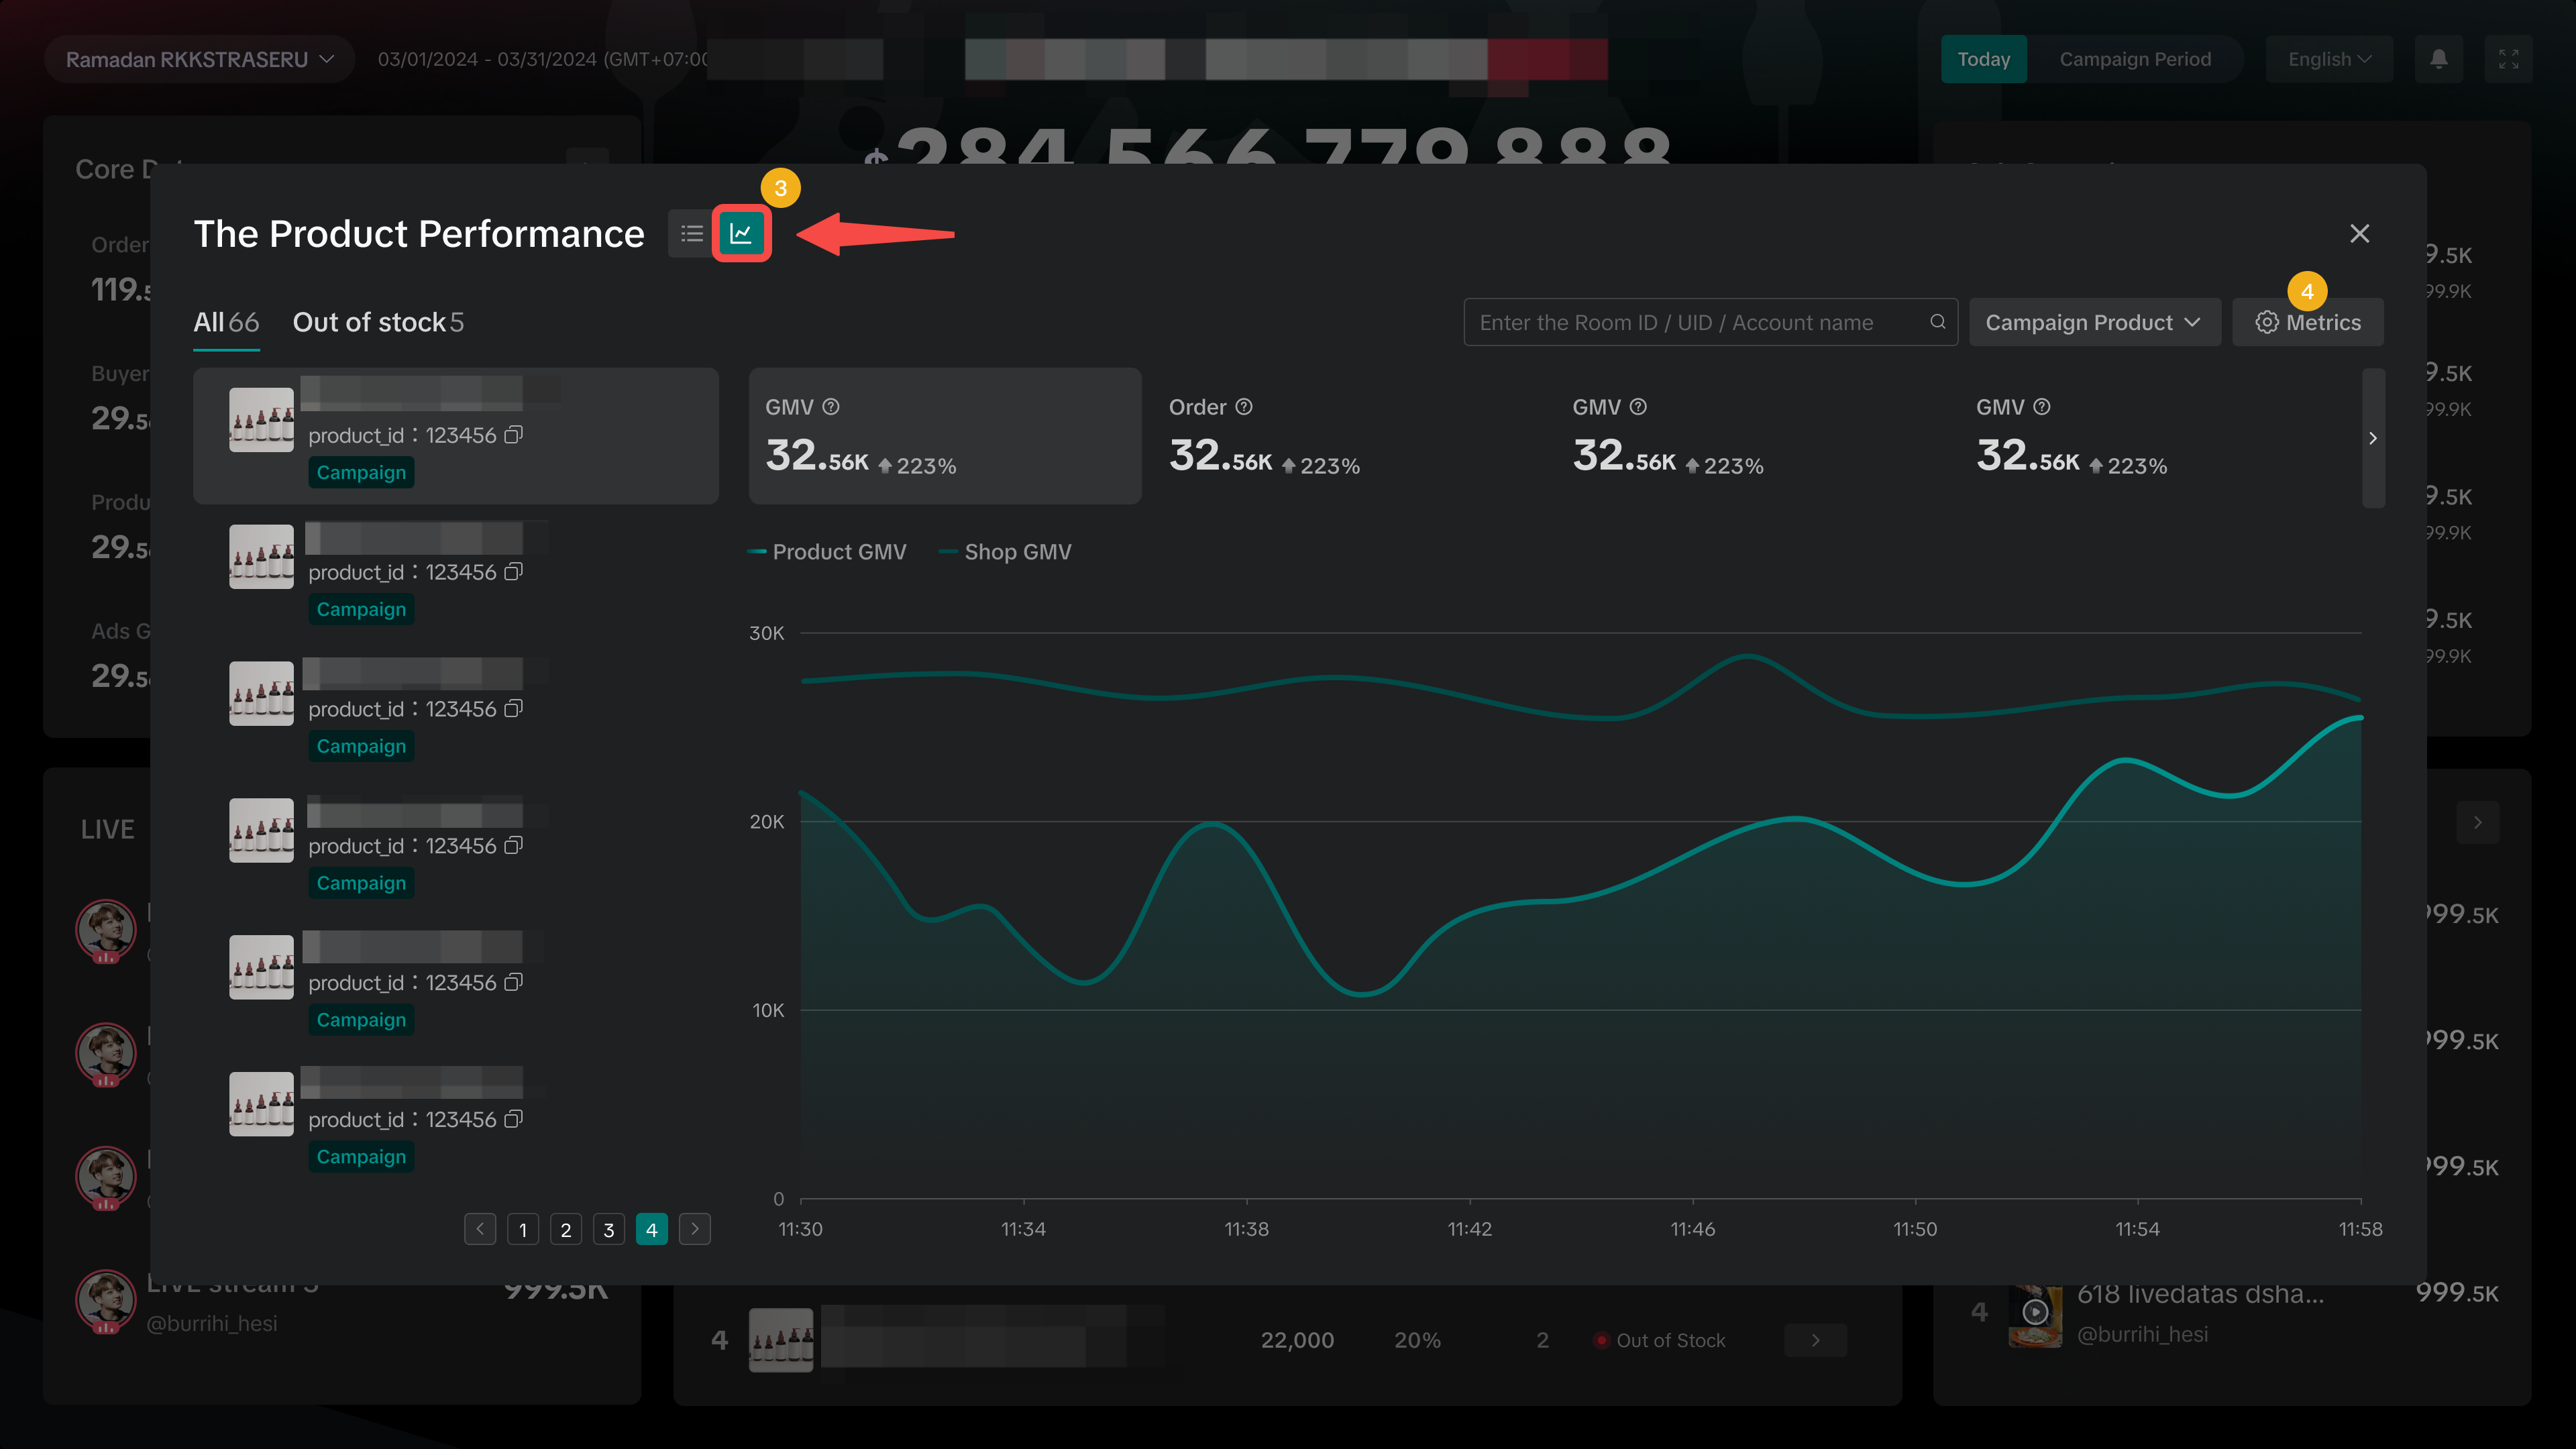
|
| Tip: Keep an eye on your fast moving products to manage stock levels effectively and prevent products going Out of Stock! Similarly, review slow moving products and optimise your promotion to boost sales. | |
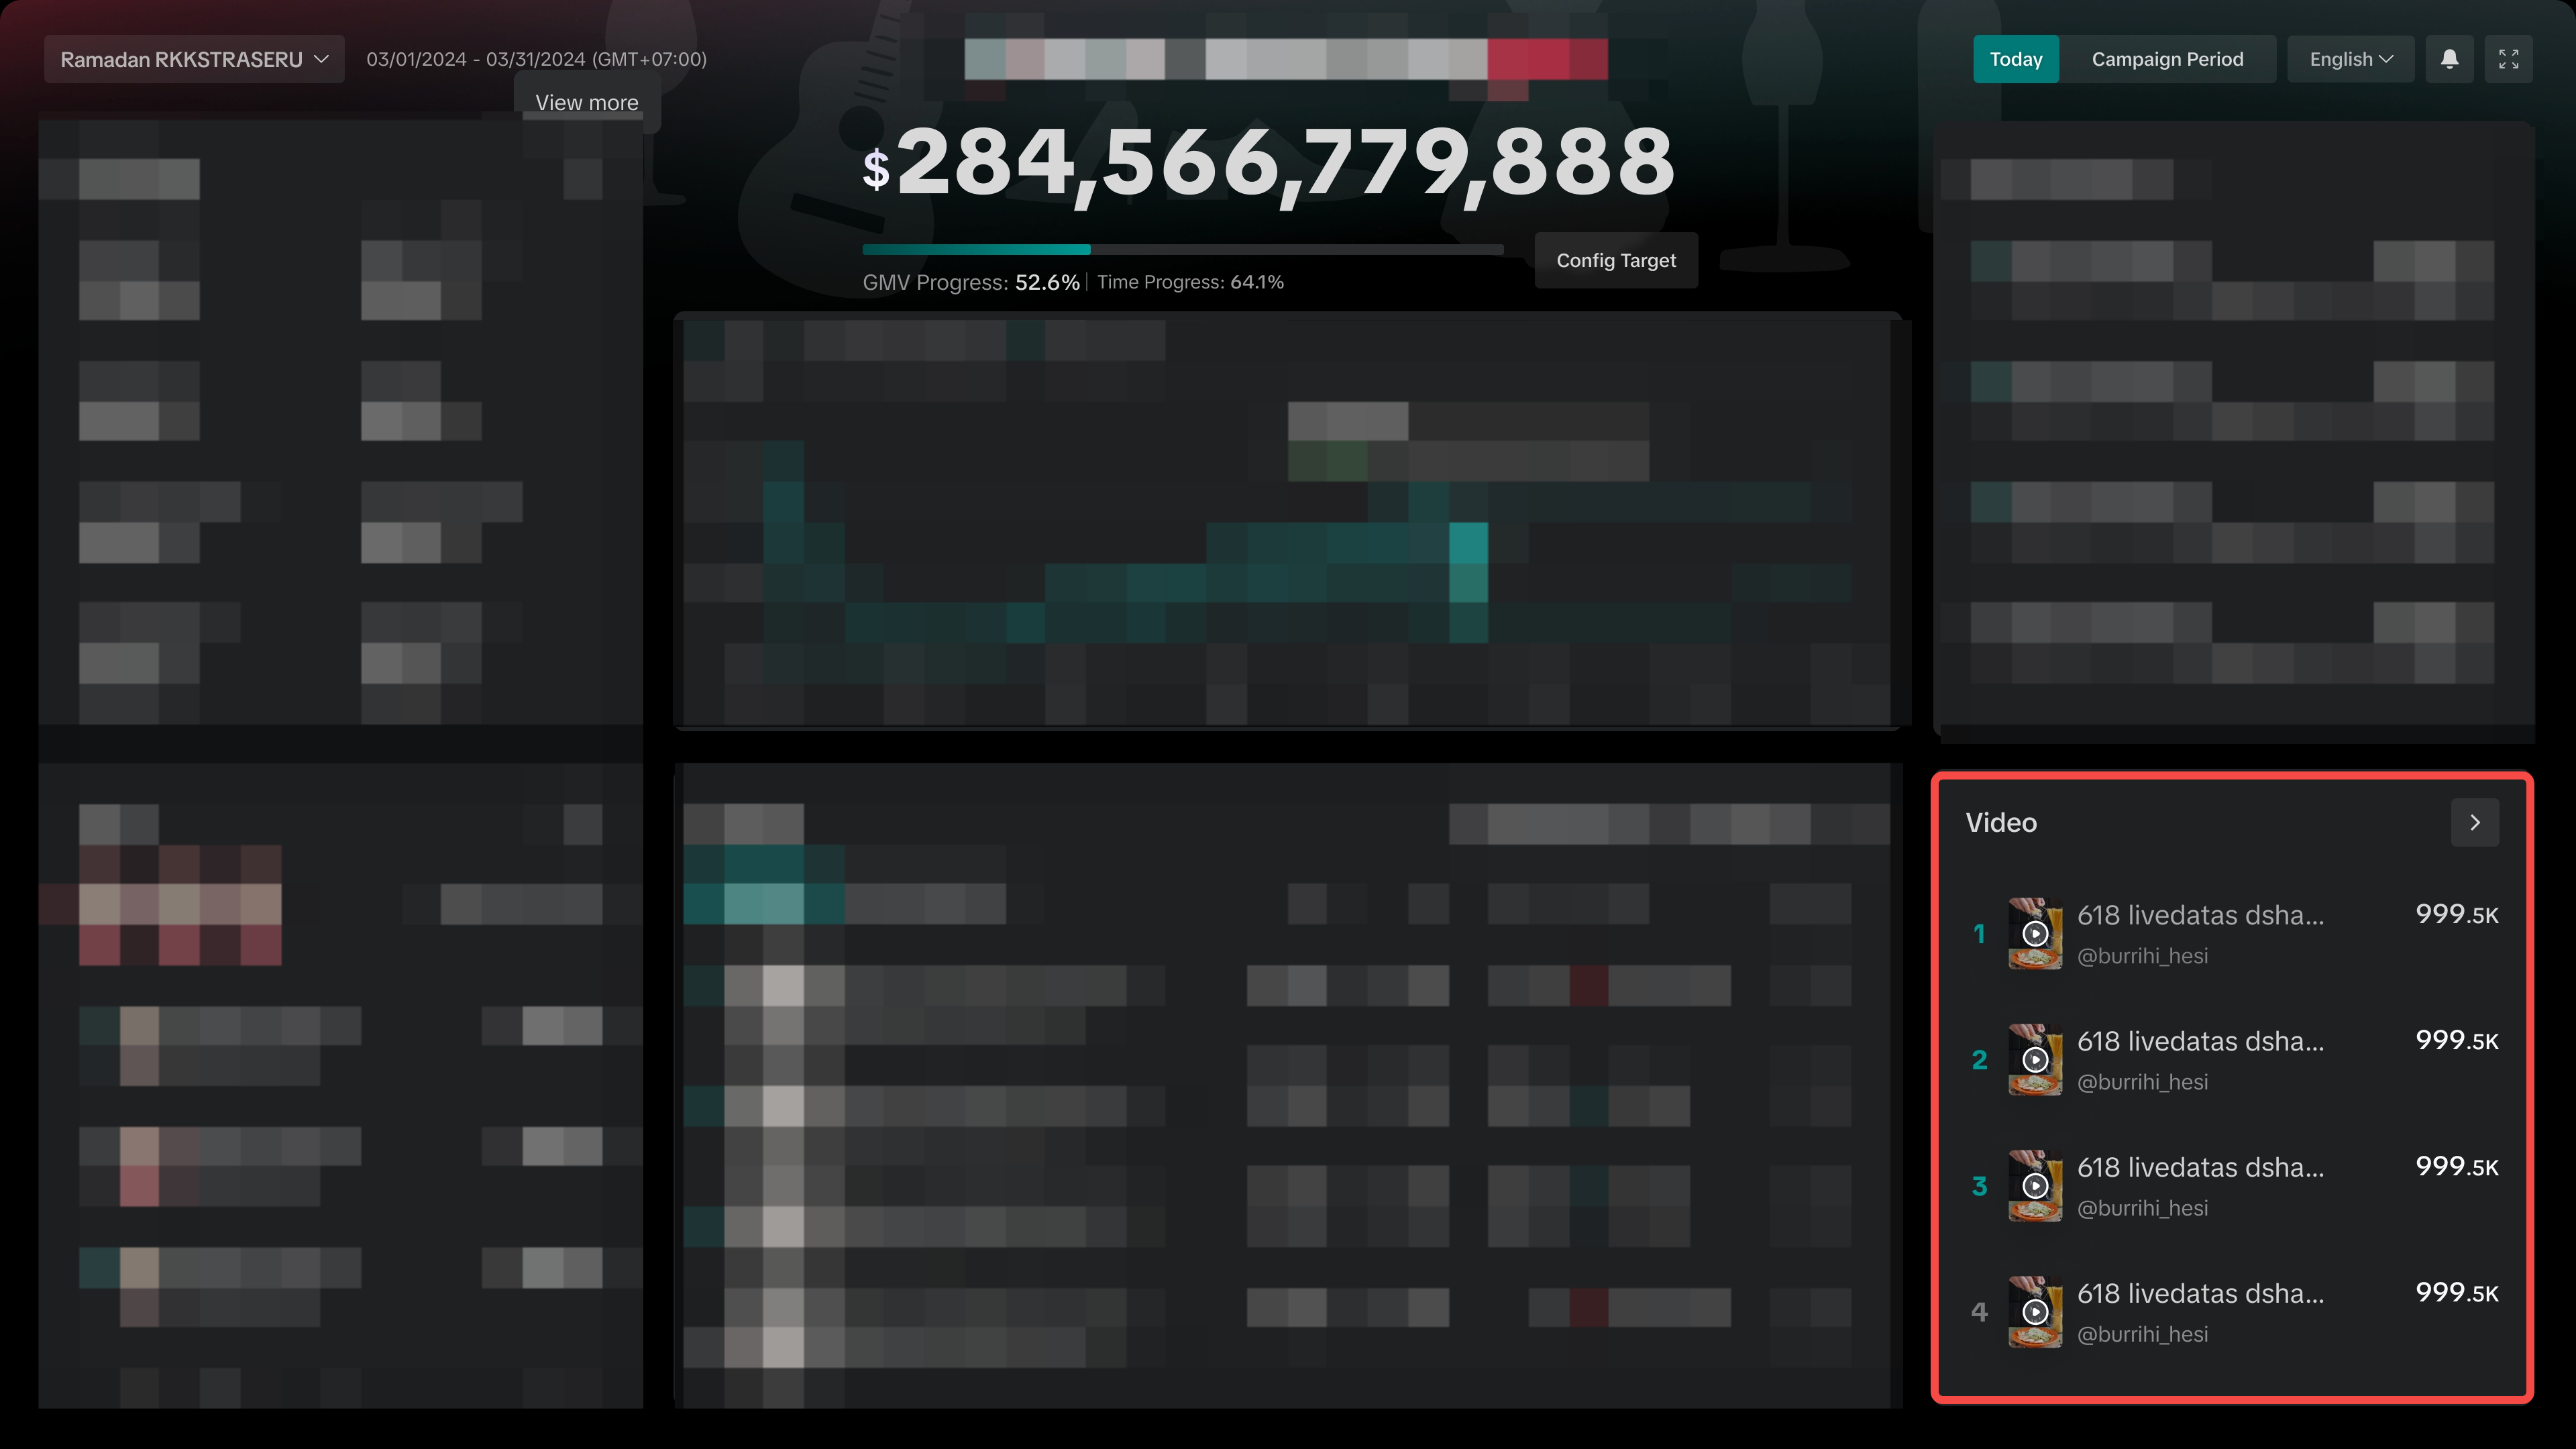
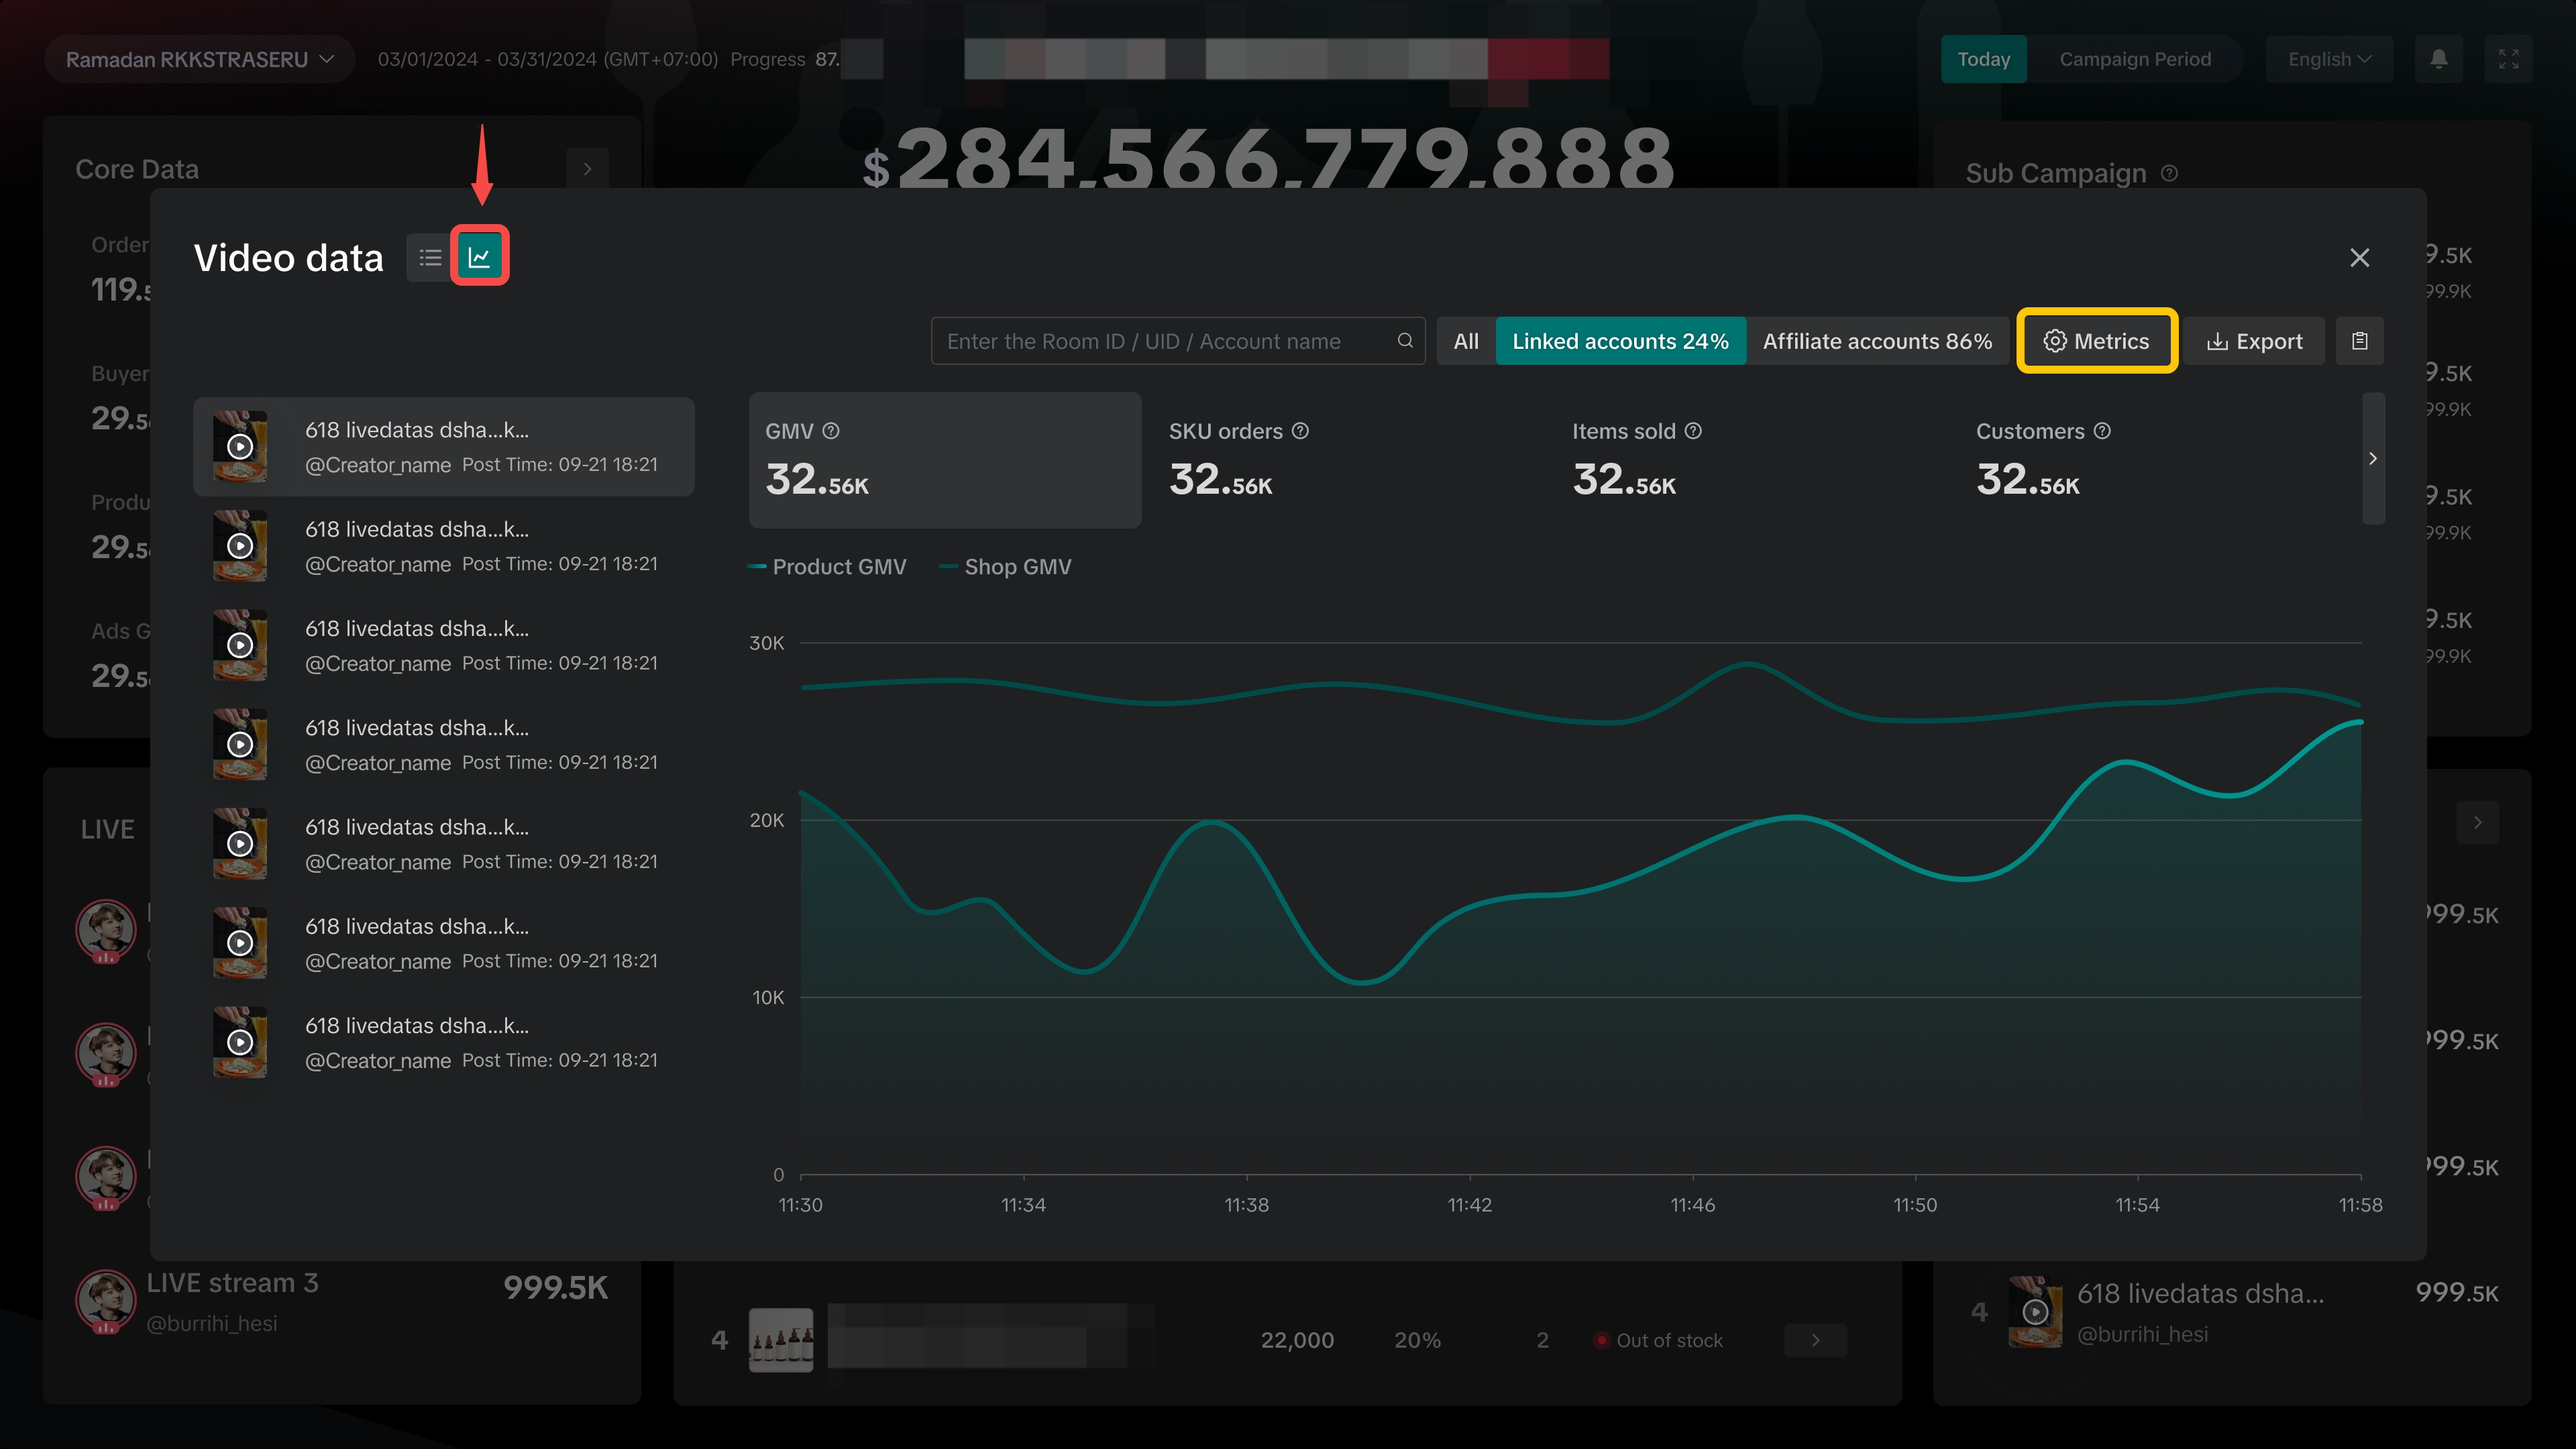
Review Performance of Videos
See the top videos ranked from highest to lowest GMV. Click on the arrow to access the full list of video performances. Currently, this section is only available when selecting ShopTokopedia campaigns.Video performance can be viewed in 2 different settings, either by product list view or by trendline view. | |
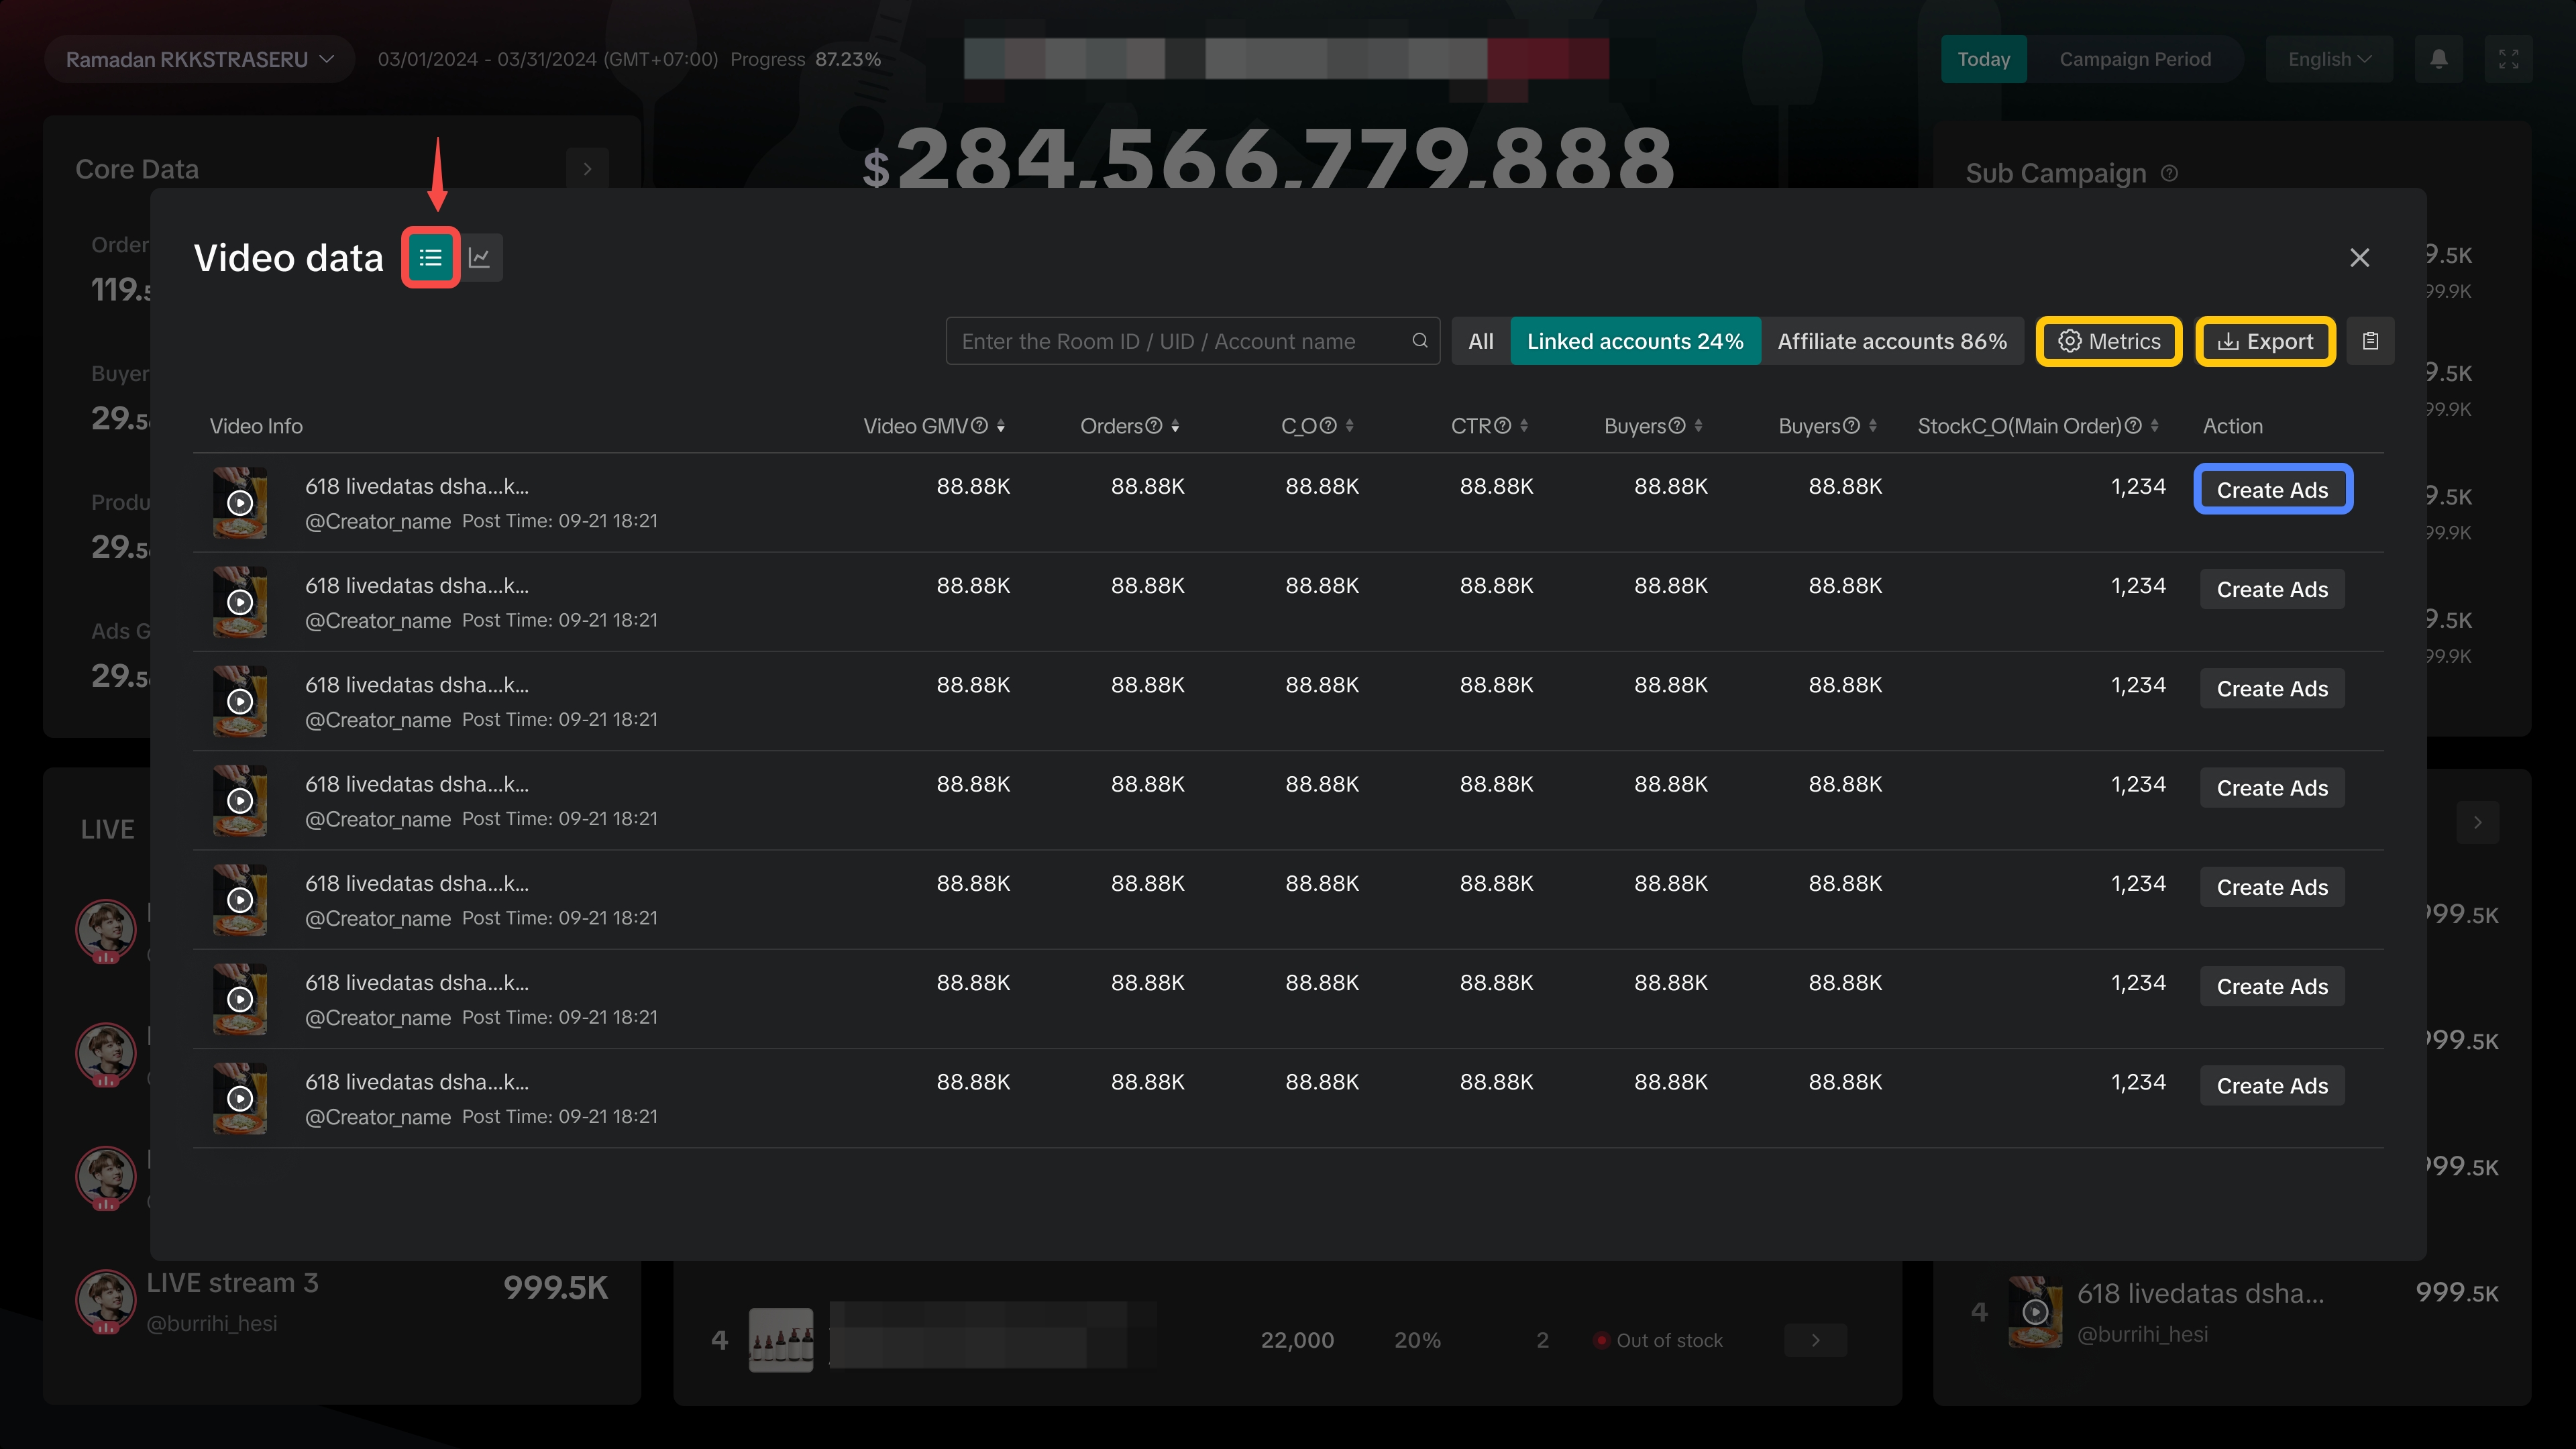
| 
|
Never Miss an Important Alert
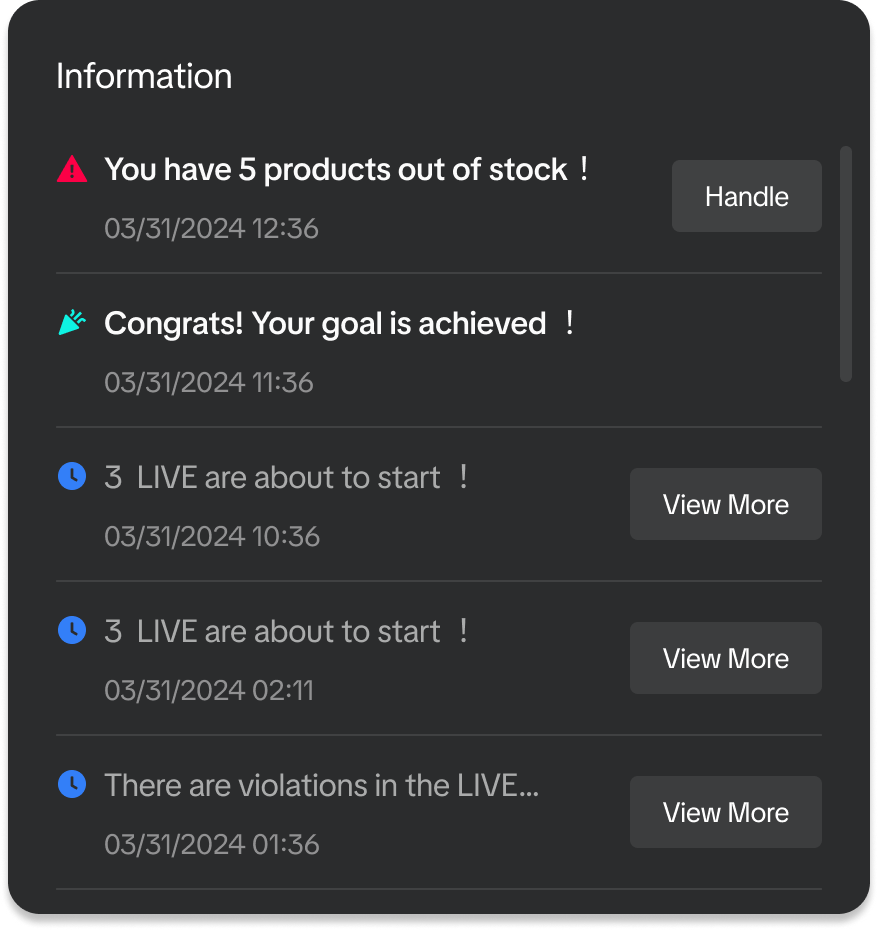 | Get important notifications and reminders such as low inventory alerts, LIVE violations, GMV target achieved, and livestream broadcast alerts. |
FAQs
- Why am I unable to find the entry points to Campaign Dashboard via Seller Center?
If you are unable to find the 2 entrance points shared above, you can also try these methods via Seller Center:
| Entrance 3 via Campaign Performance | Entrance 4 via Sub Campaign Analytics | ||
Data Compass > Marketing > Campaign Performance | Promotions > Campaigns > Manage Your Campaigns | ||
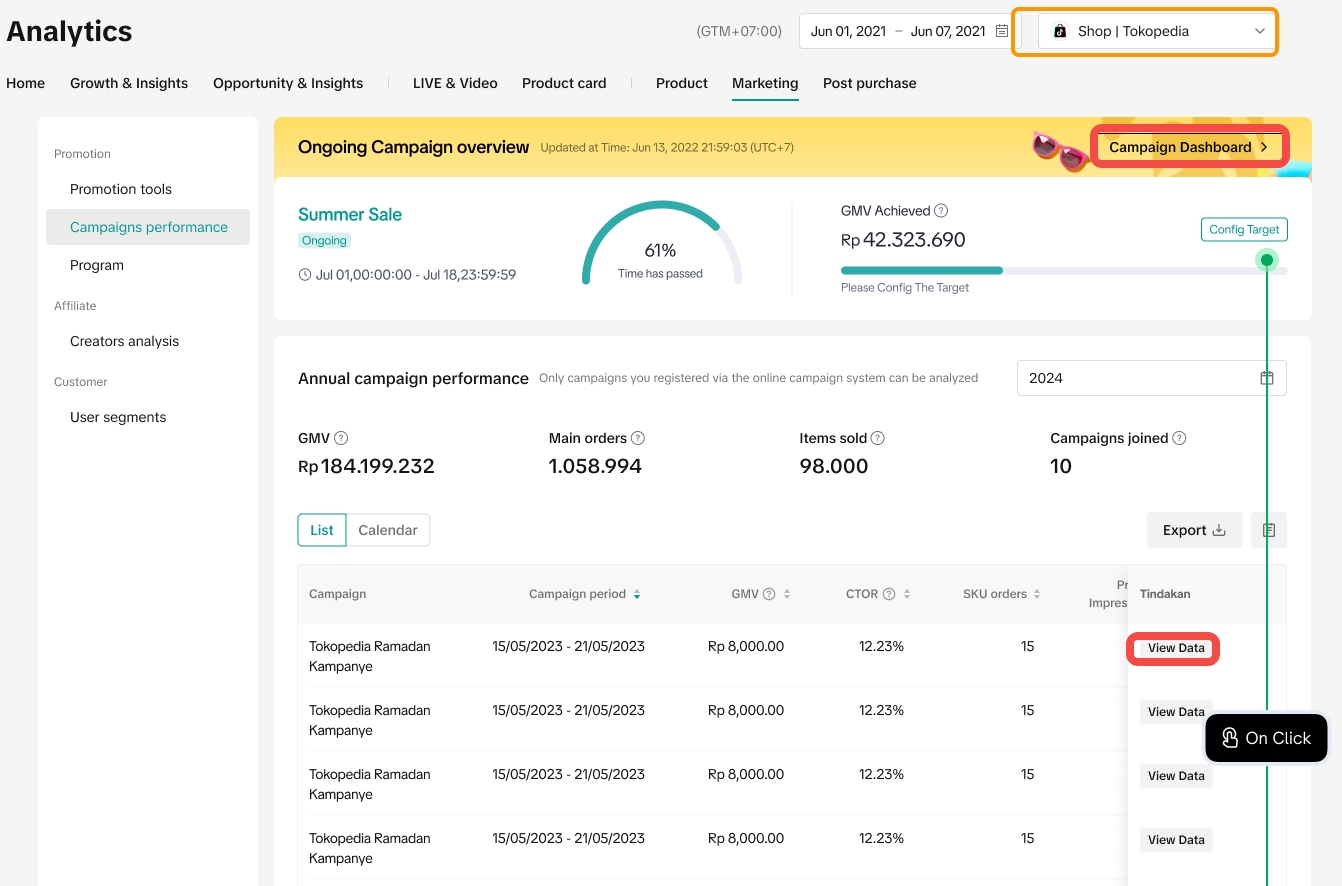 | 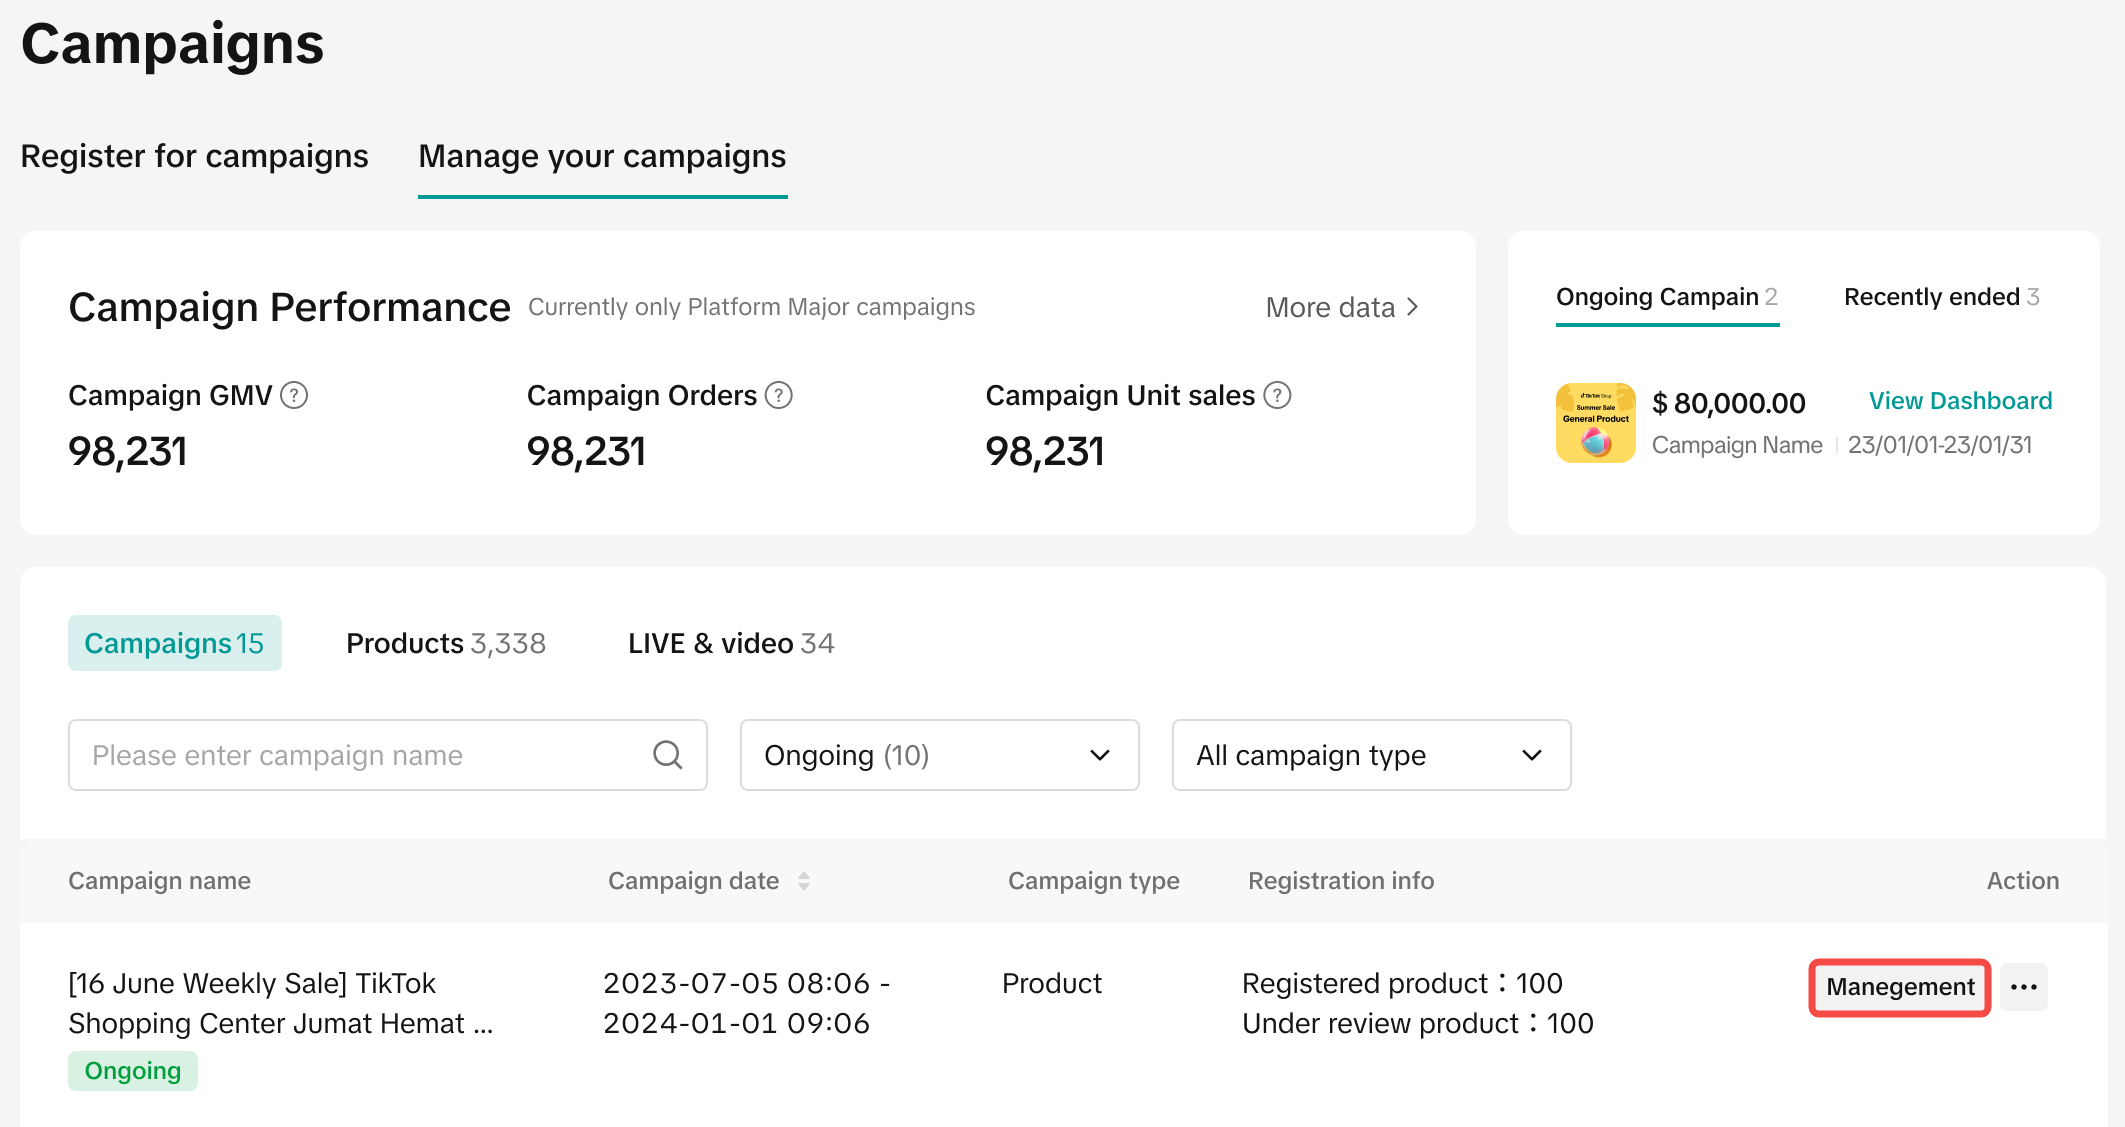 | 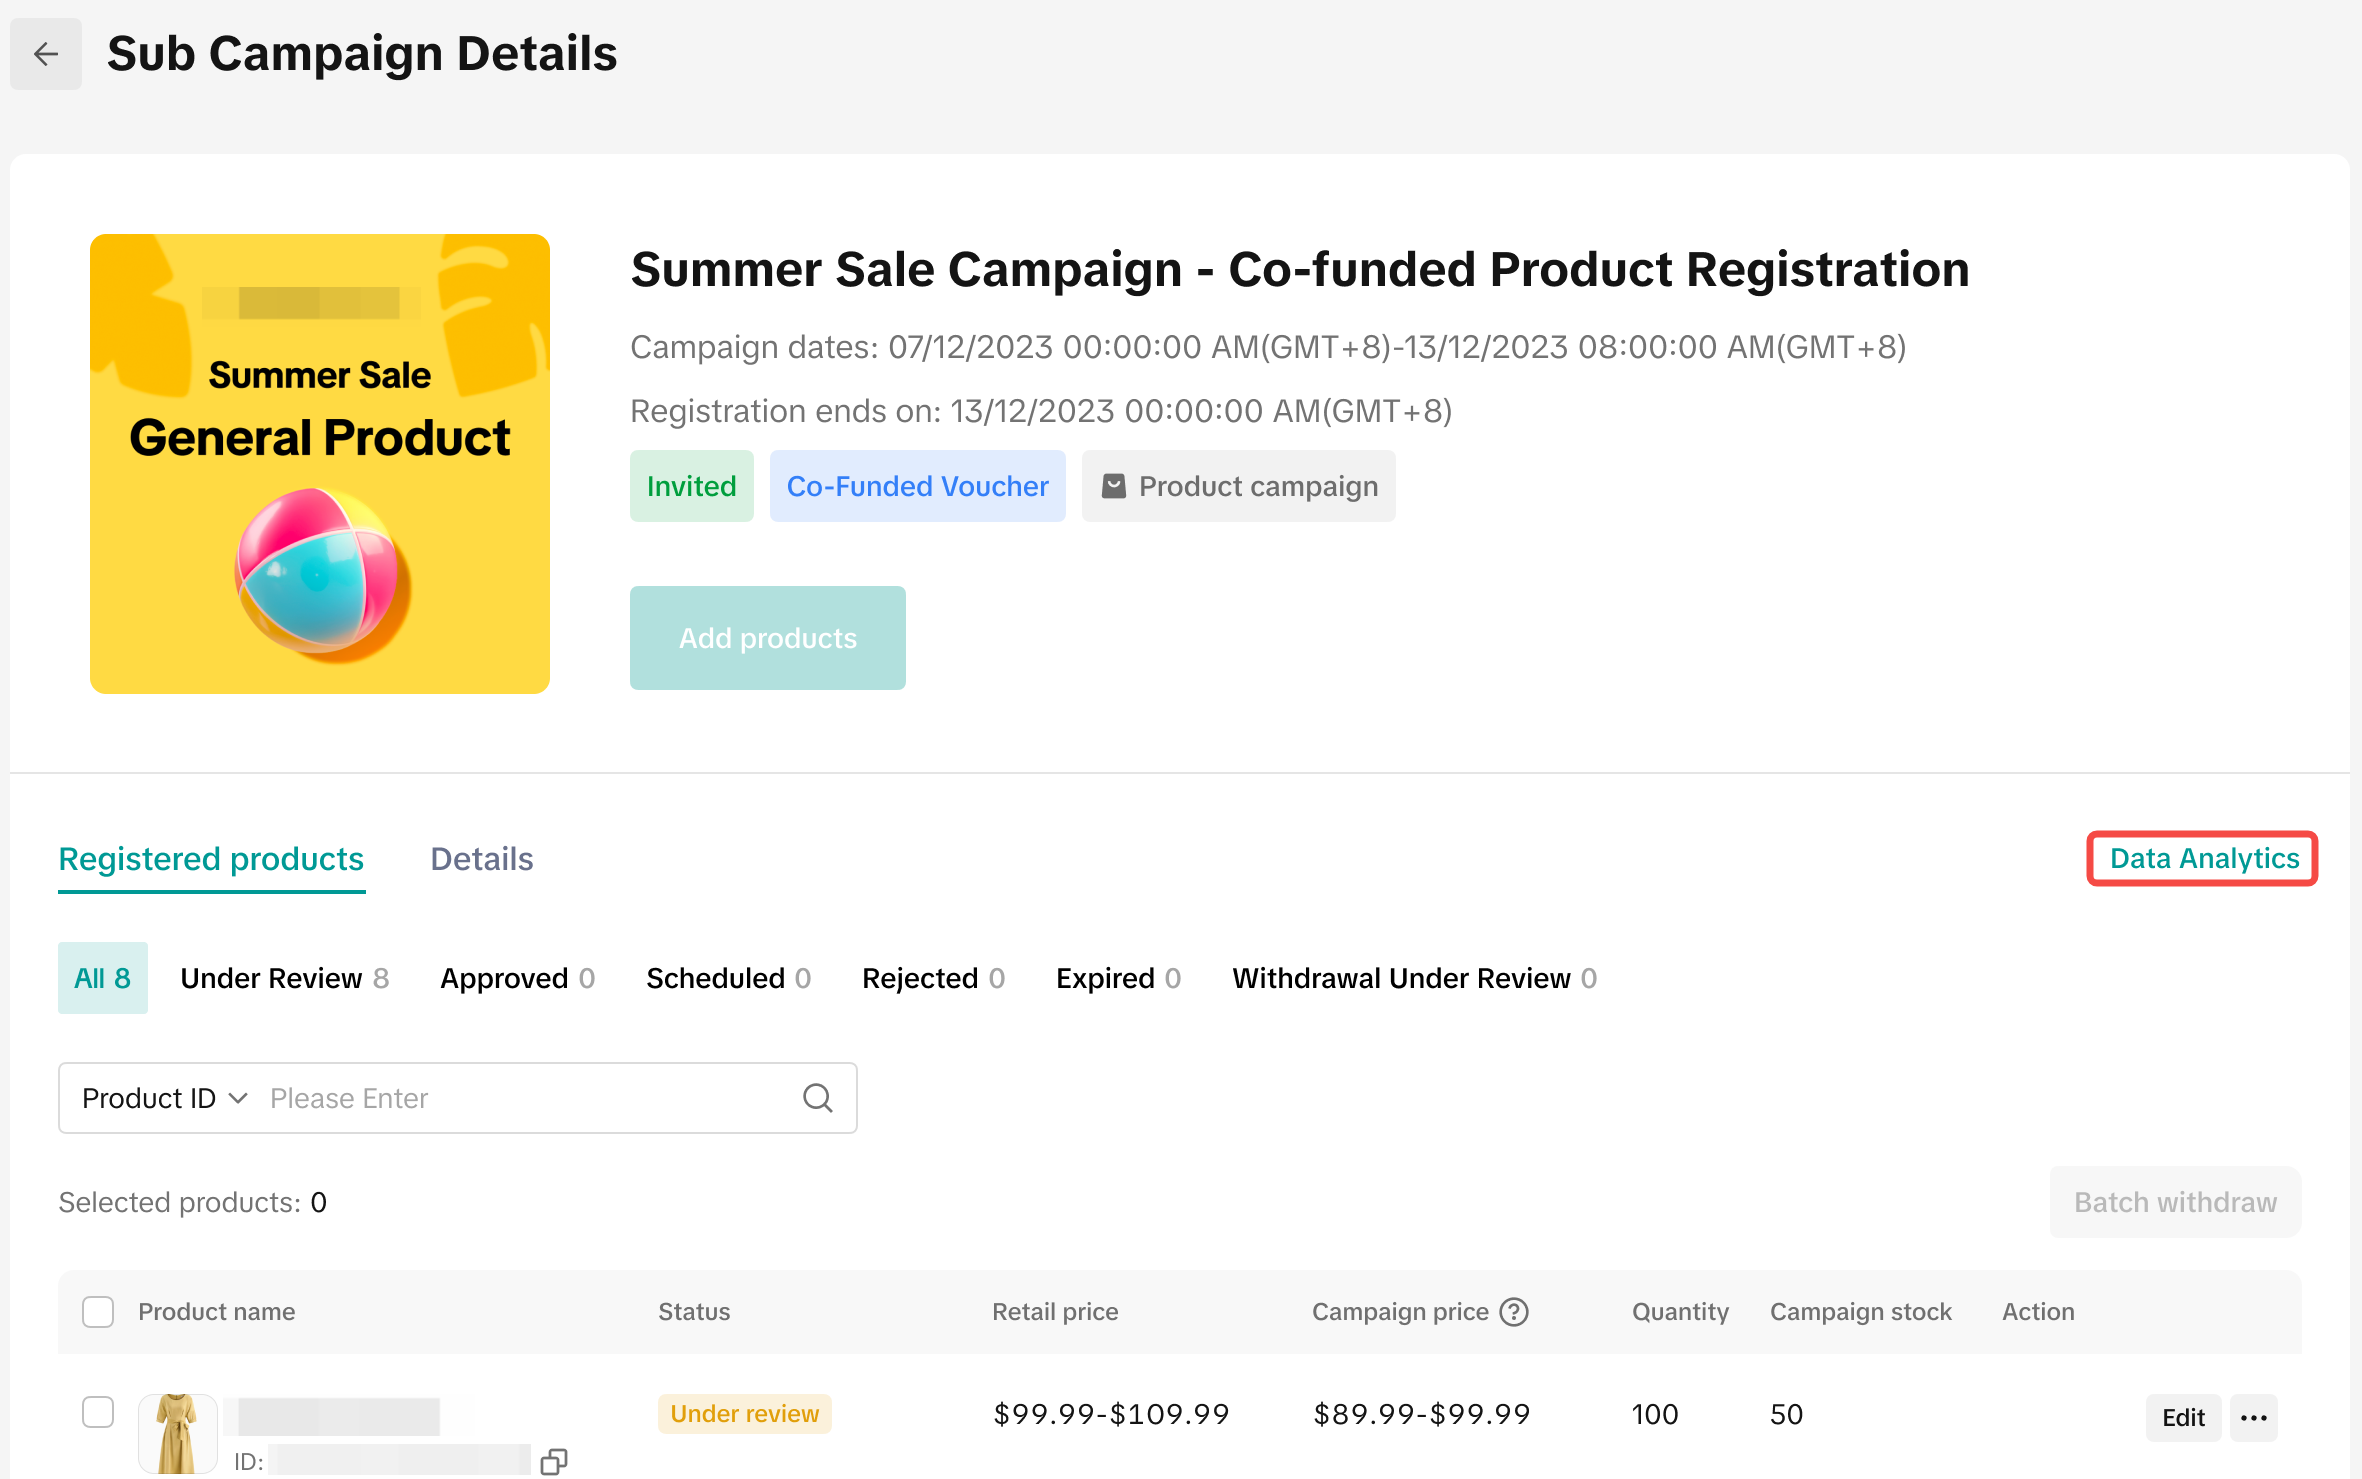 | 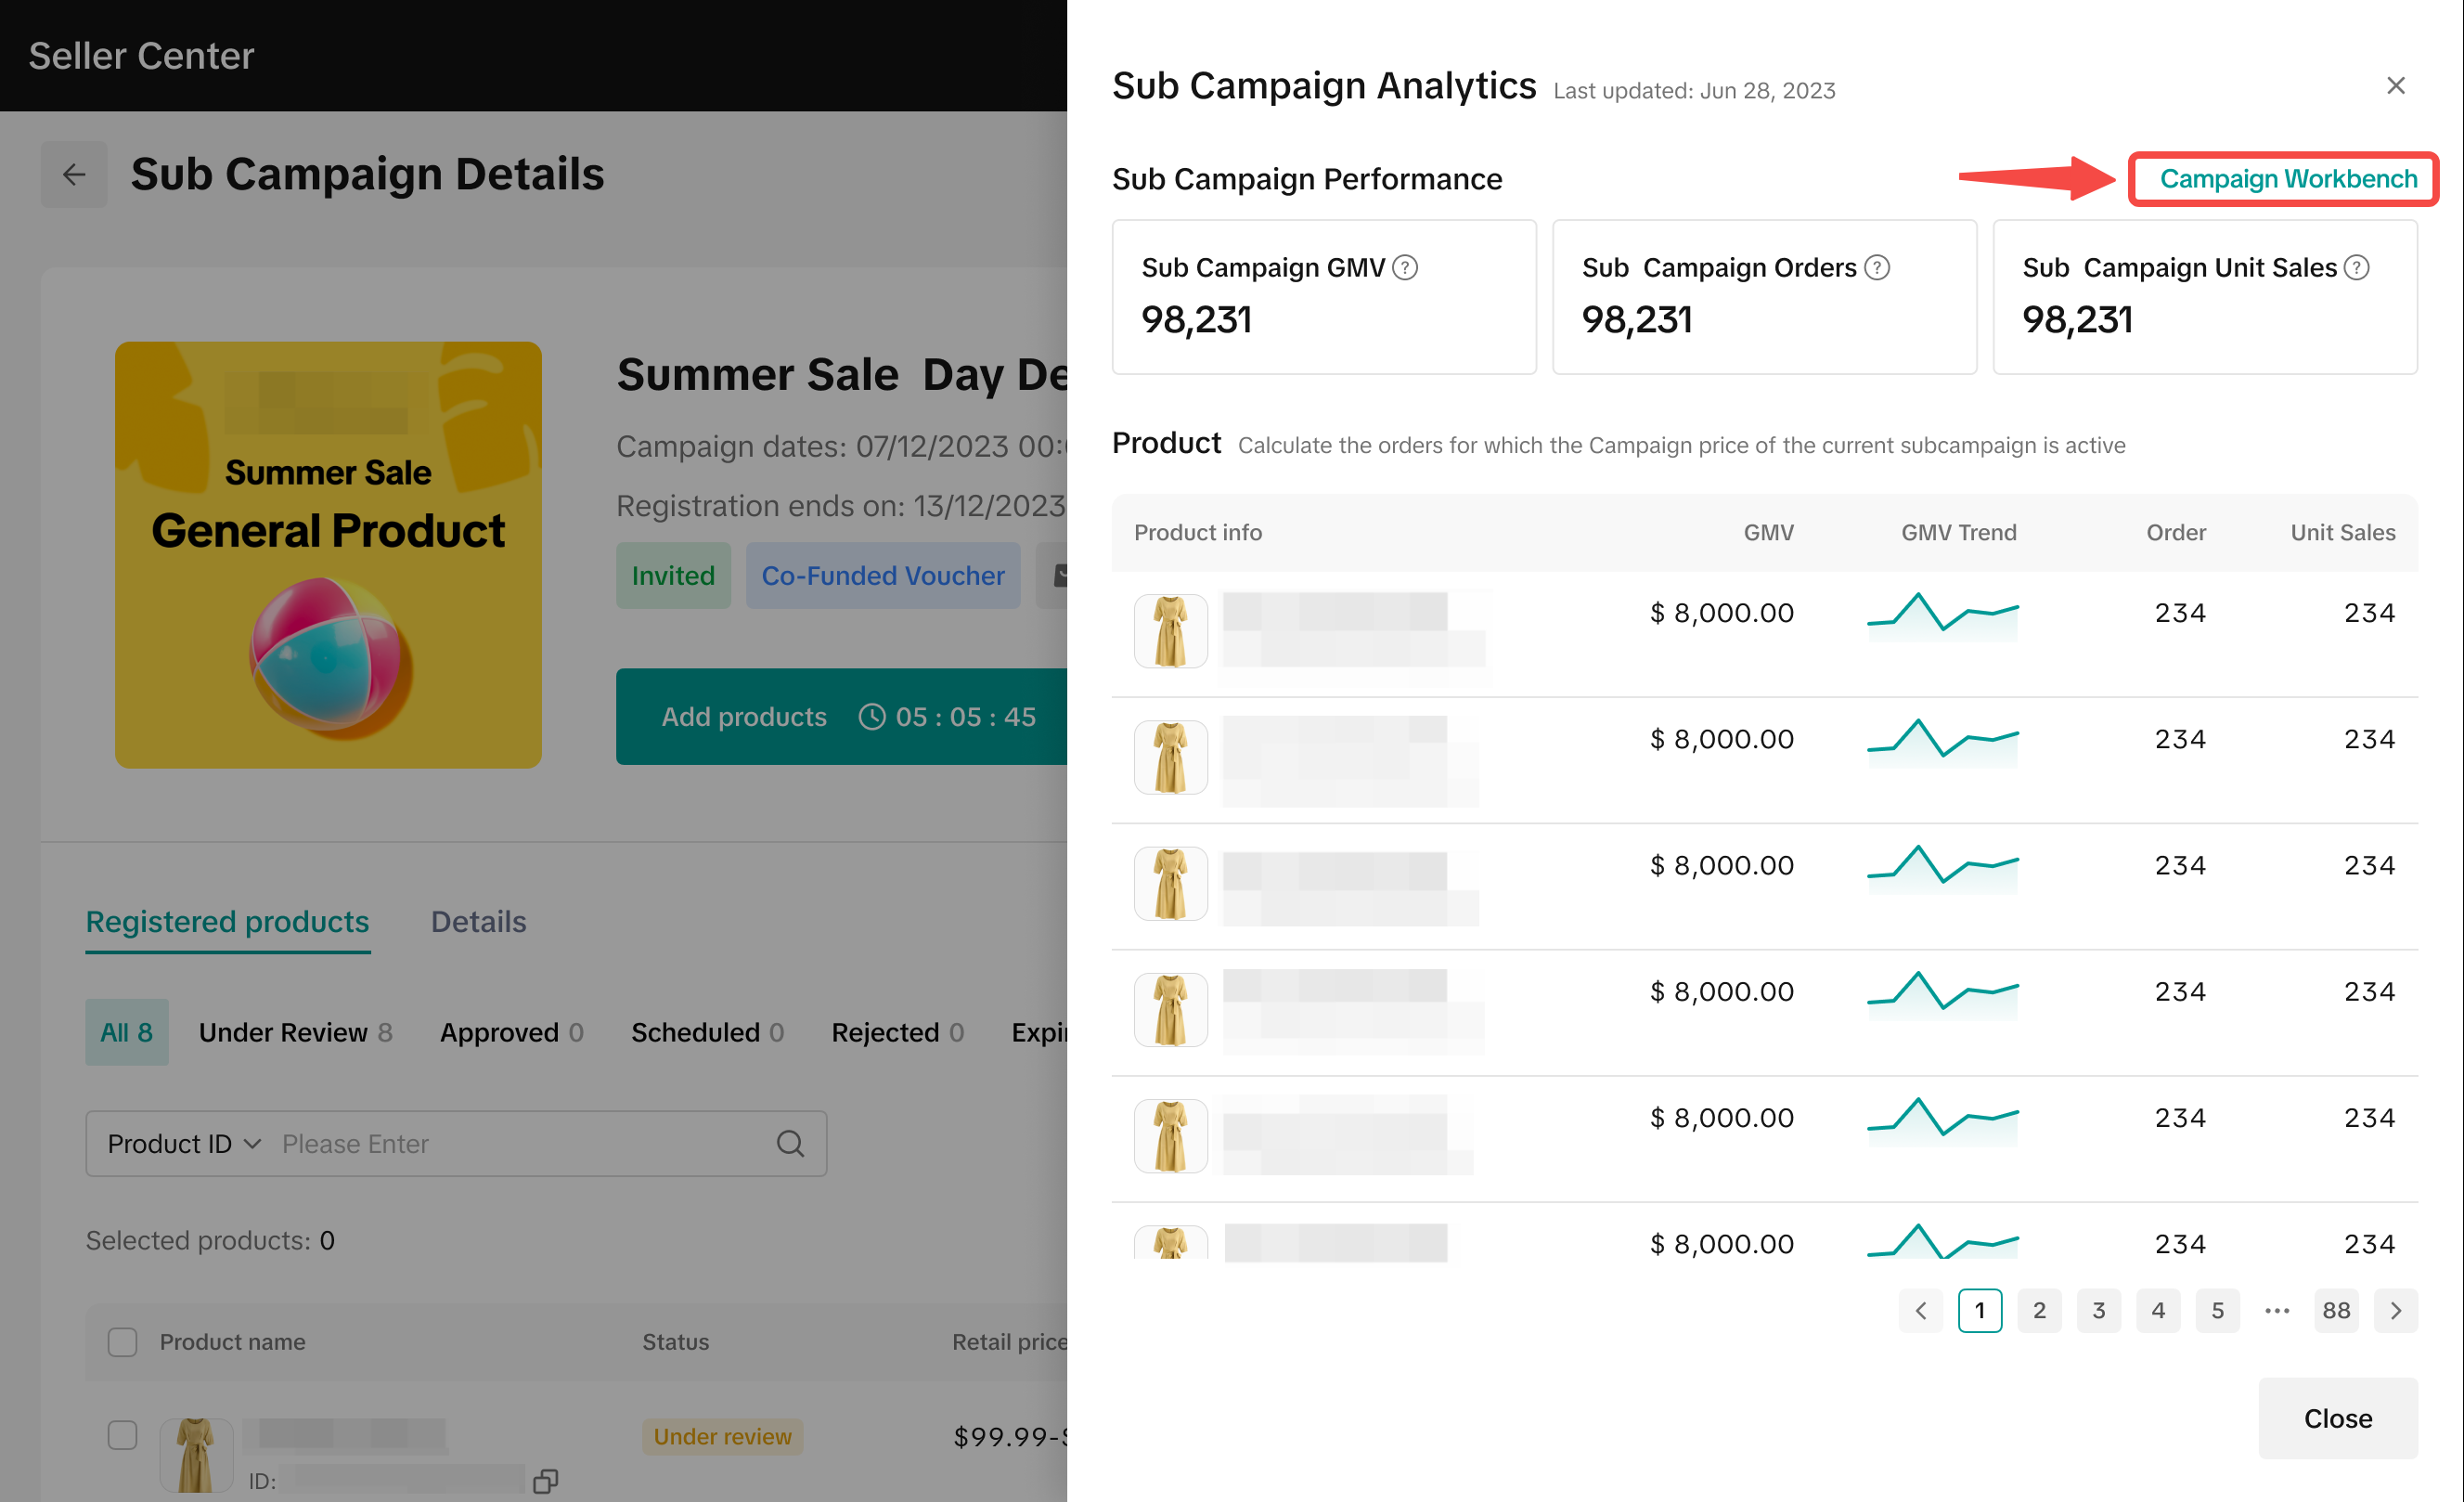 |
| Click on Campaign Dashboard or Campaign Workbench | Click on Management > Click on Data Analytics > Click on Campaign Workbench | ||
- Can I still access Campaign Dashboard after the campaign has ended?