

Analyzing Product Performance for Creators
03/18/2026
This article will show you how to use Product analytics, allowing you to understand the products that are driving the most revenue, commission and refunds so that you can optimise your product strategy effectively.
Highlights
In-depth Product analysis - Click on any product to drill down into key performance indicators.
Understand product performance of different channels - check which channels are driving the most conversions, livestreams, video or showcase.
Analyze Conversion funnel - By comparing the conversion rates of different products, gain more insight into which products are being abandoned so you can optimize performance.


When selecting a custom time range, the user analysis module is not displayed. It is recommended to view the user analysis using a time period of the last 7 days, the last 28 days, day, week, and month.
Highlights
See GMV, commission, traffic and refund performance of the products you've sold
See which Videos and Livestreams sell the most products
Get more insight into why you lost customers and who is interested in the products you are promoting
How to use Product Analytics
See high level product metrics - find the products that are driving the most revenue, commission and refunds so that you can optimize your product strategy.In-depth Product analysis - Click on any product to drill down into key performance indicators.
Understand product performance of different channels - check which channels are driving the most conversions, livestreams, video or showcase.
Analyze Conversion funnel - By comparing the conversion rates of different products, gain more insight into which products are being abandoned so you can optimize performance.
App
Enter through: TikTok Shop Creator Center > data It will display data for today and the last 7 days, Click into the [>] at metrics to land onto the Data page.The Key metrics section gives you a birds-eye overview of your overall performance during your selected time period. It is divided into two tabs Overview and Commissions. You can switch it as you want.
| 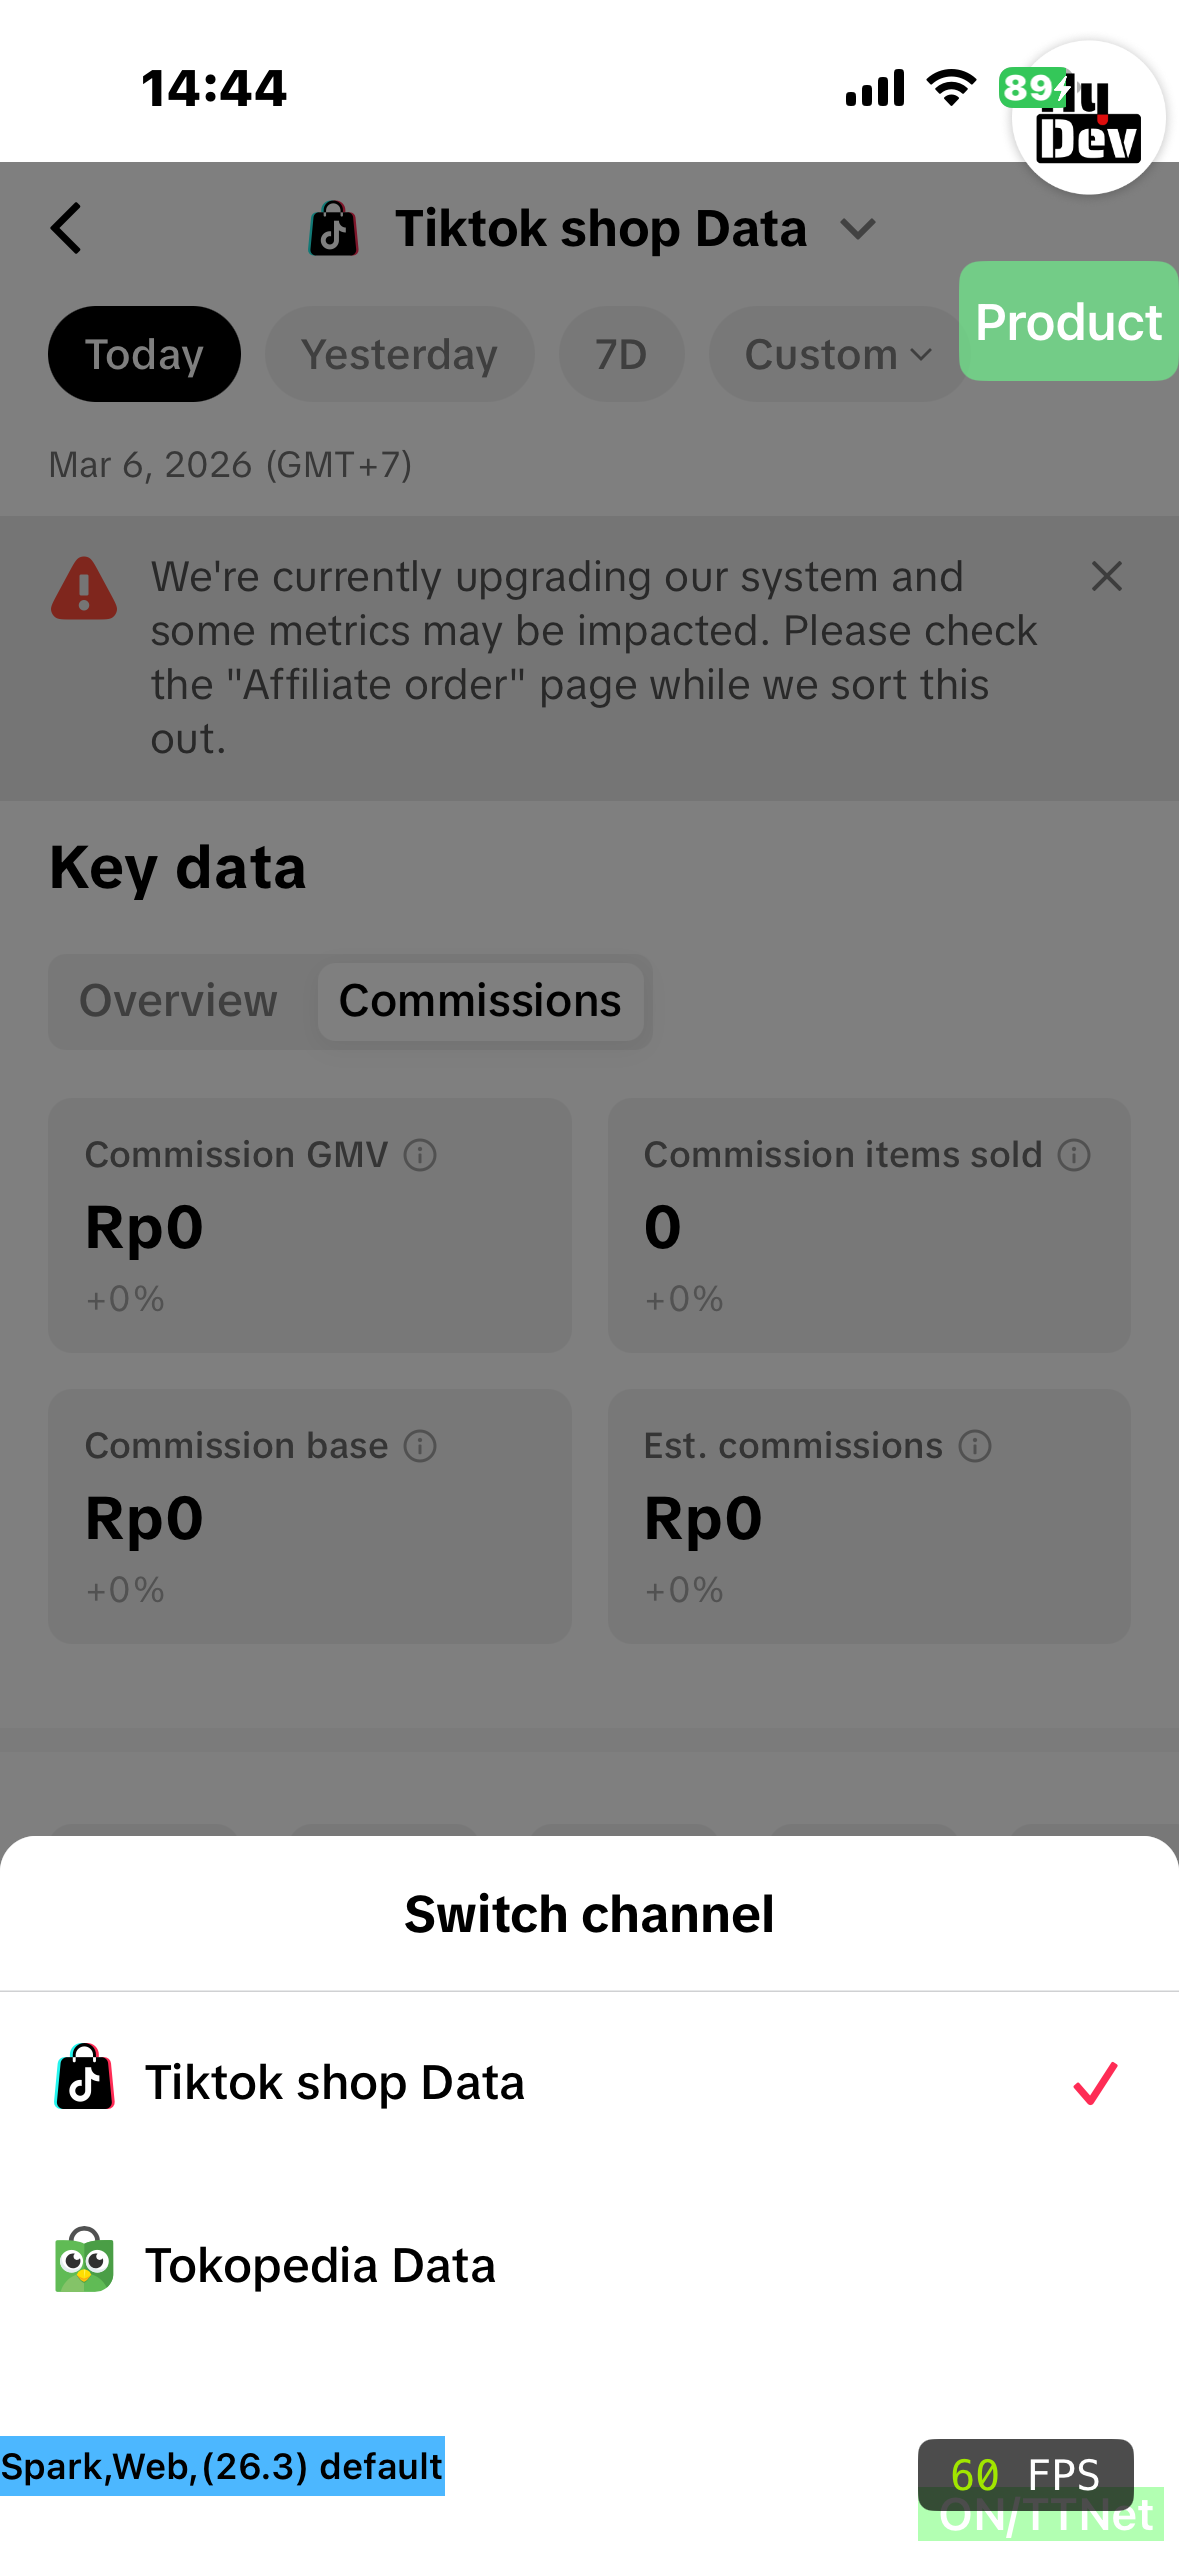 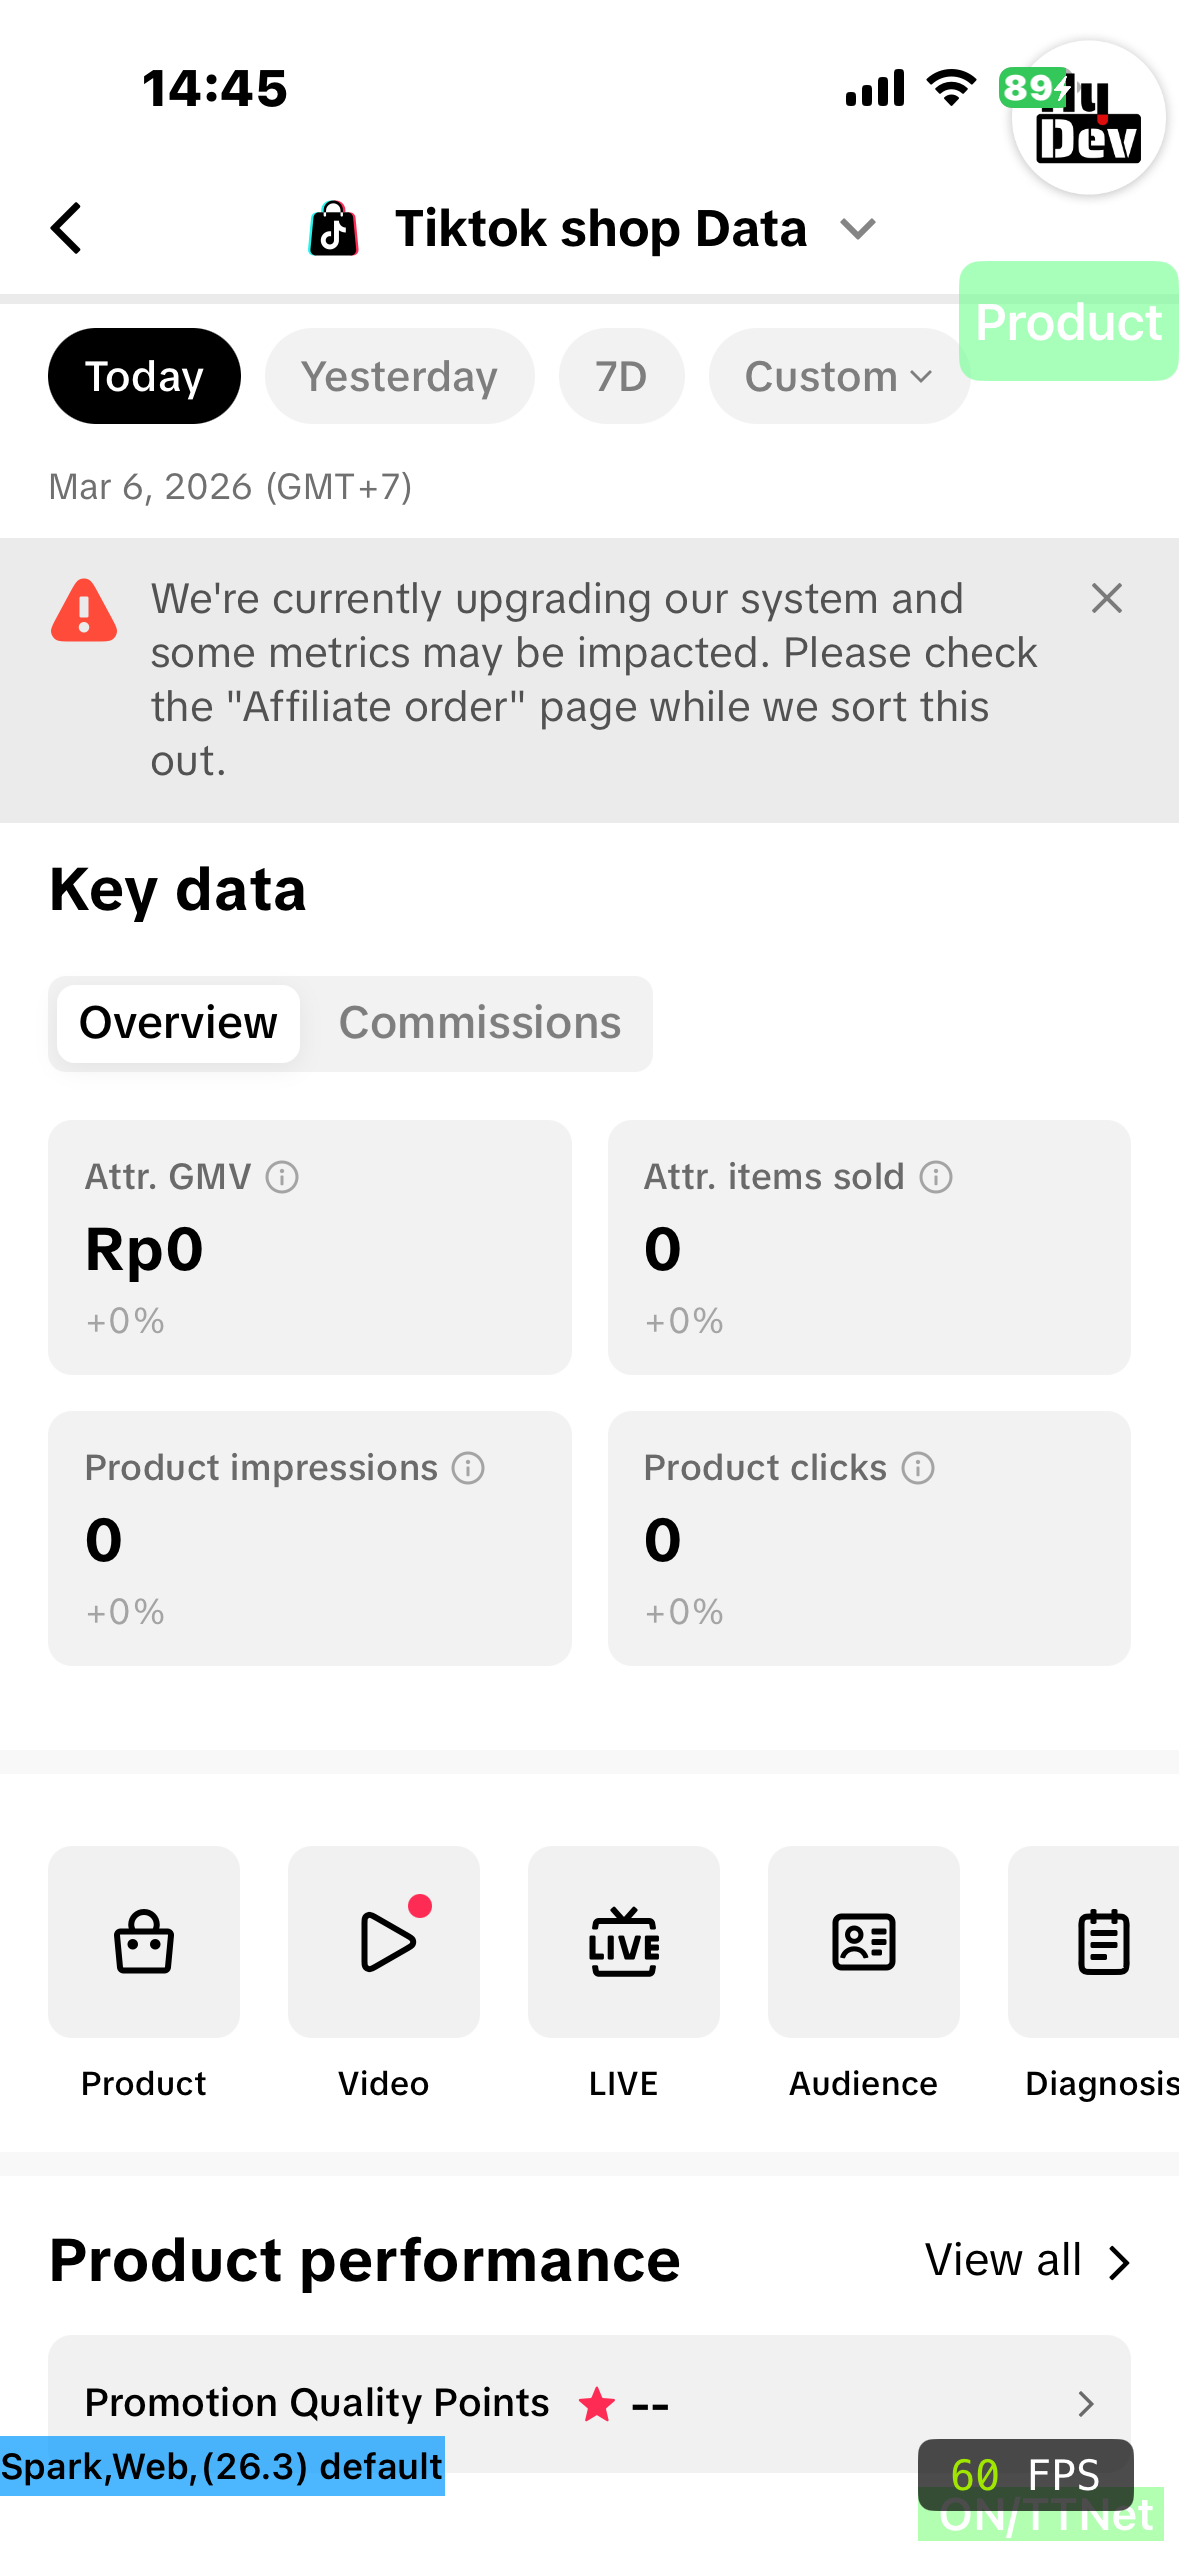 |
| Time selectionYou can choose to view data for [Today], [Yesterday], [Last 7 Days] or [Custom] time.ProductIf you click on [Product], you will be taken to the product overview page where you can see all the products you are promoting as well as their corresponding metrics. Product Performance In this section, you can see the GMV, Est Commission and Item sold metrics for your top performing products. You will be provided with Promotion Quality Points (PQP) rating. This is a 5-star points system ranging from 0 (critical) to 5 (excellent) that helps creators to select better and more reliable shops and products to promote to their viewers. | 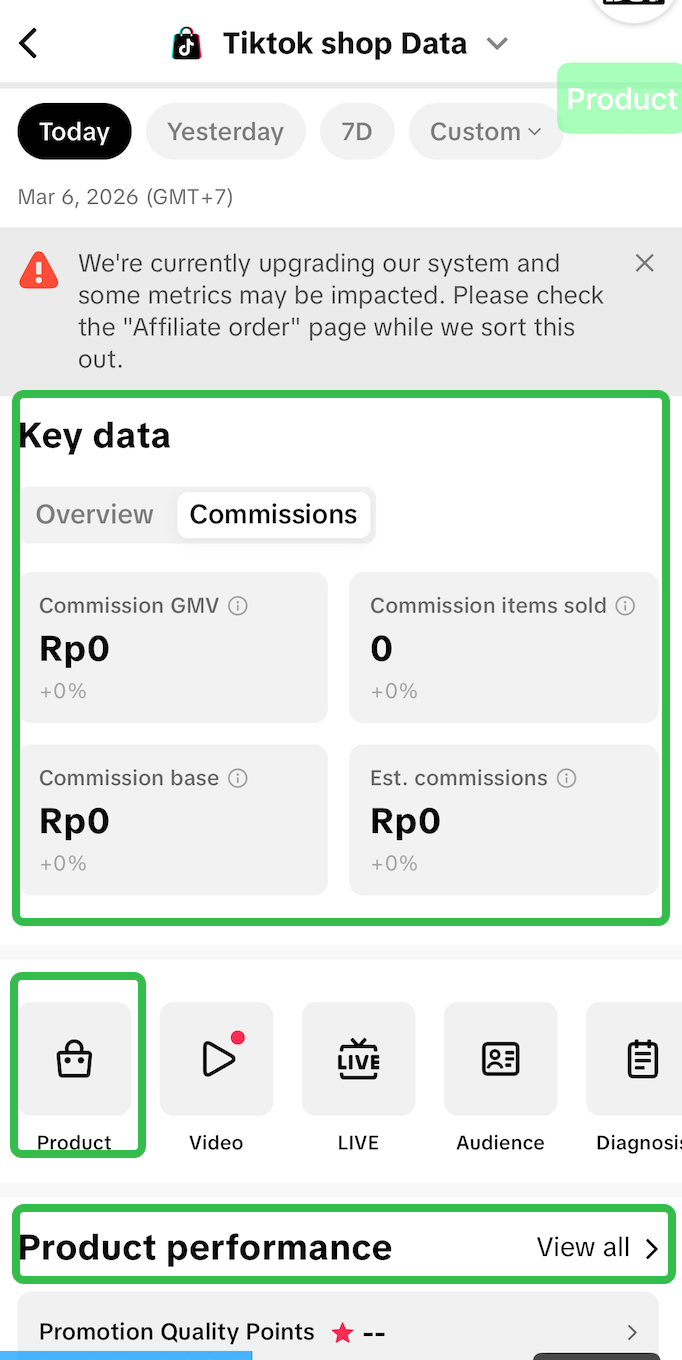 |
| Product Performance Here you can see the product list of all your products, as well as the key metrics such as GMV, Est Commission and Items sold. Top Products You can easily find the top performing product here, allowing you to understand which products are performing with your audience base and therefore providing you with commissions.Product listTo make it easier to find a product, you can search for it by name in the search bar. | 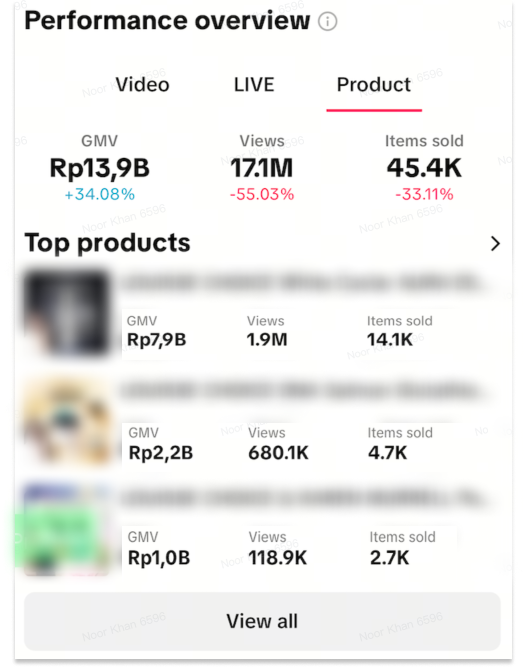 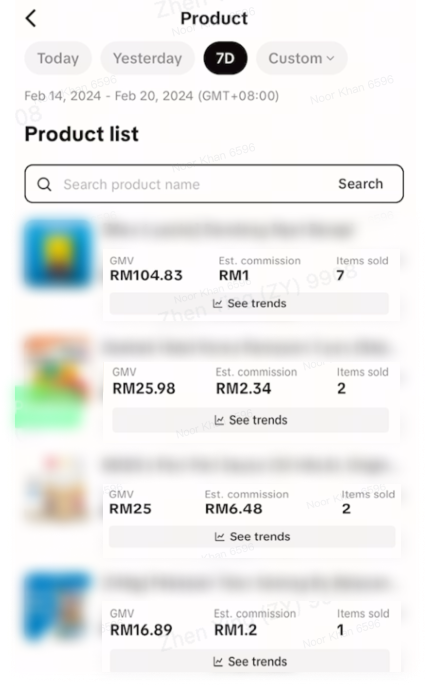 |
Streamer desktop
- Product Ranking & Product List
Go to: Streamer Desktop > Data Compass > Product AnalysisIn this section you can do the following:Product List
Export Data
Search Products Quickly search for specific products according to product nameHere GMV and Est. Commission are calculated using the Commission Based Attribution logic. This means that the GMV shown here takes into account attributed GMV from affiliate promotion in order to make sure that the commission paid to you via Affiliate Plans is accurate. | 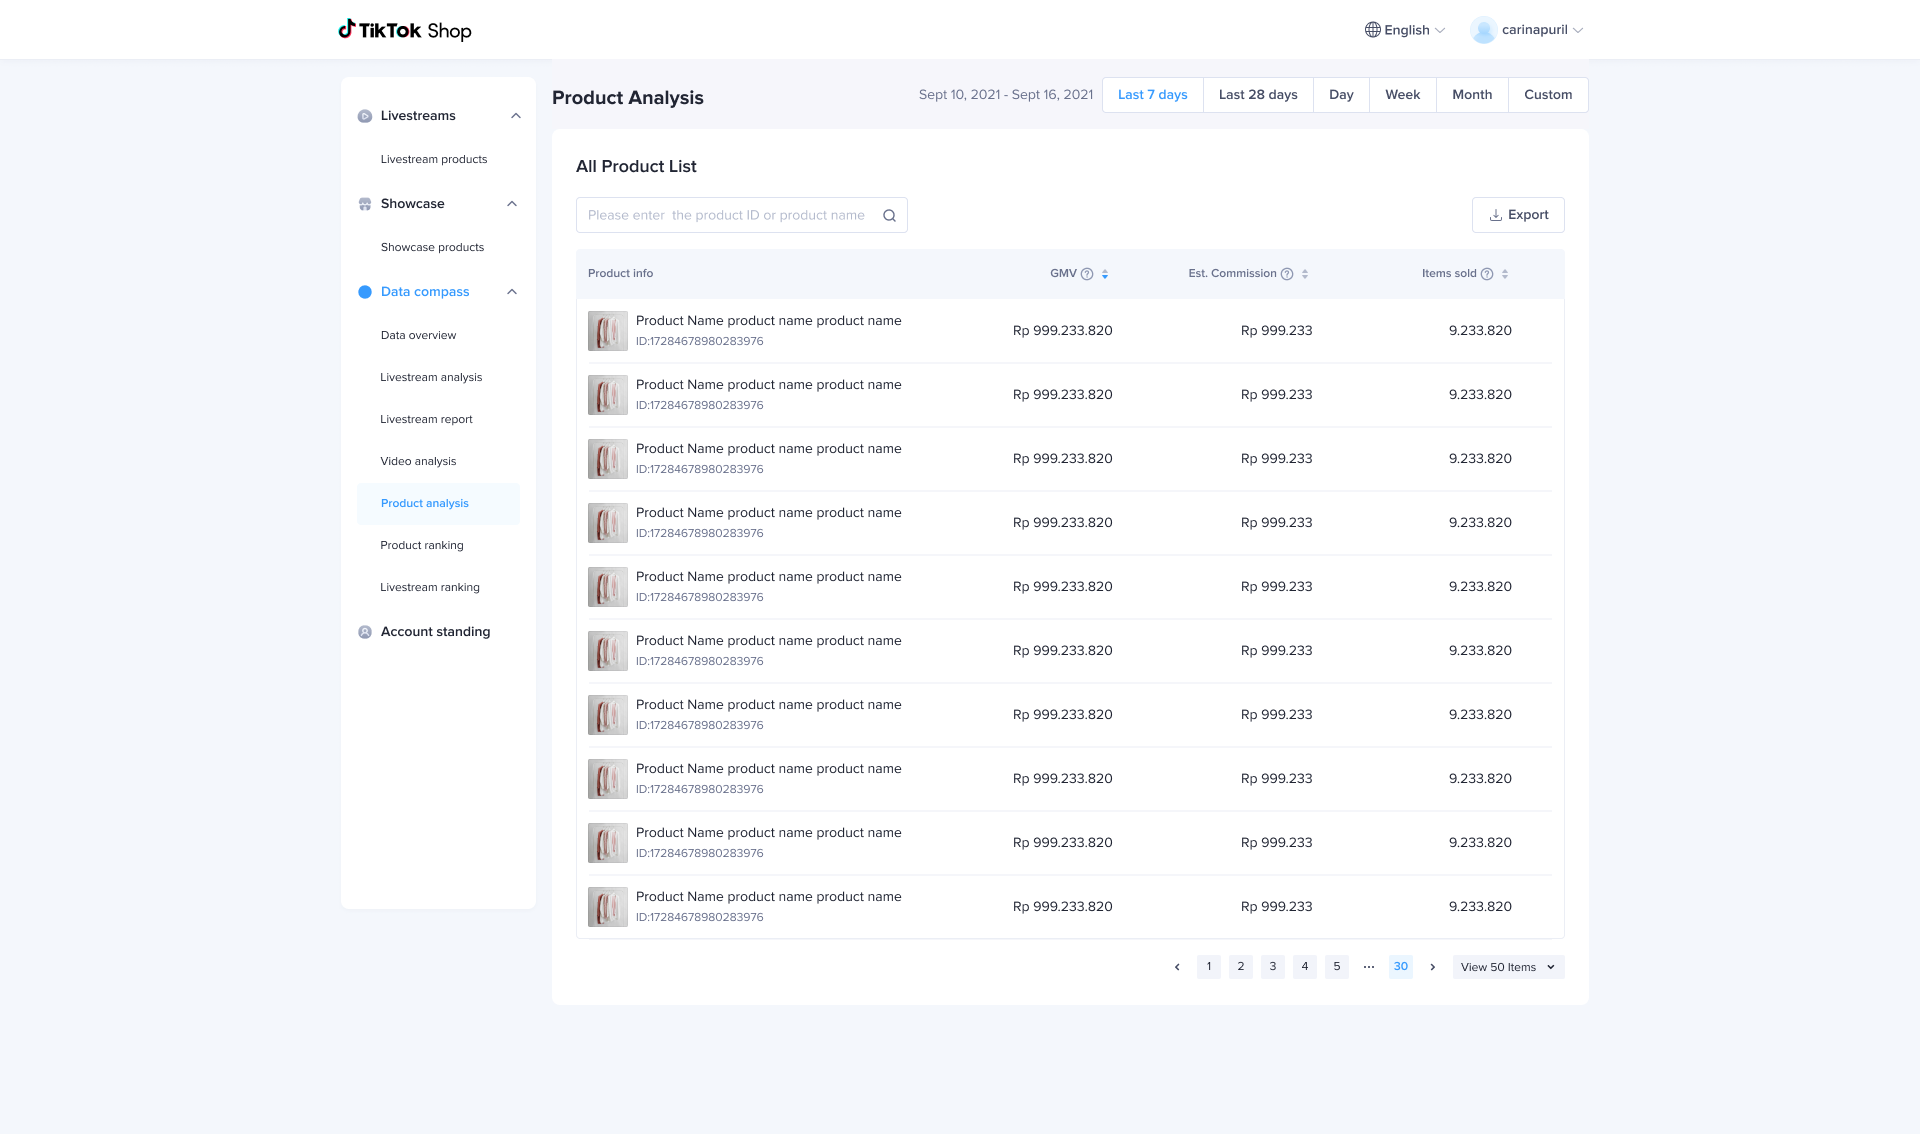 |
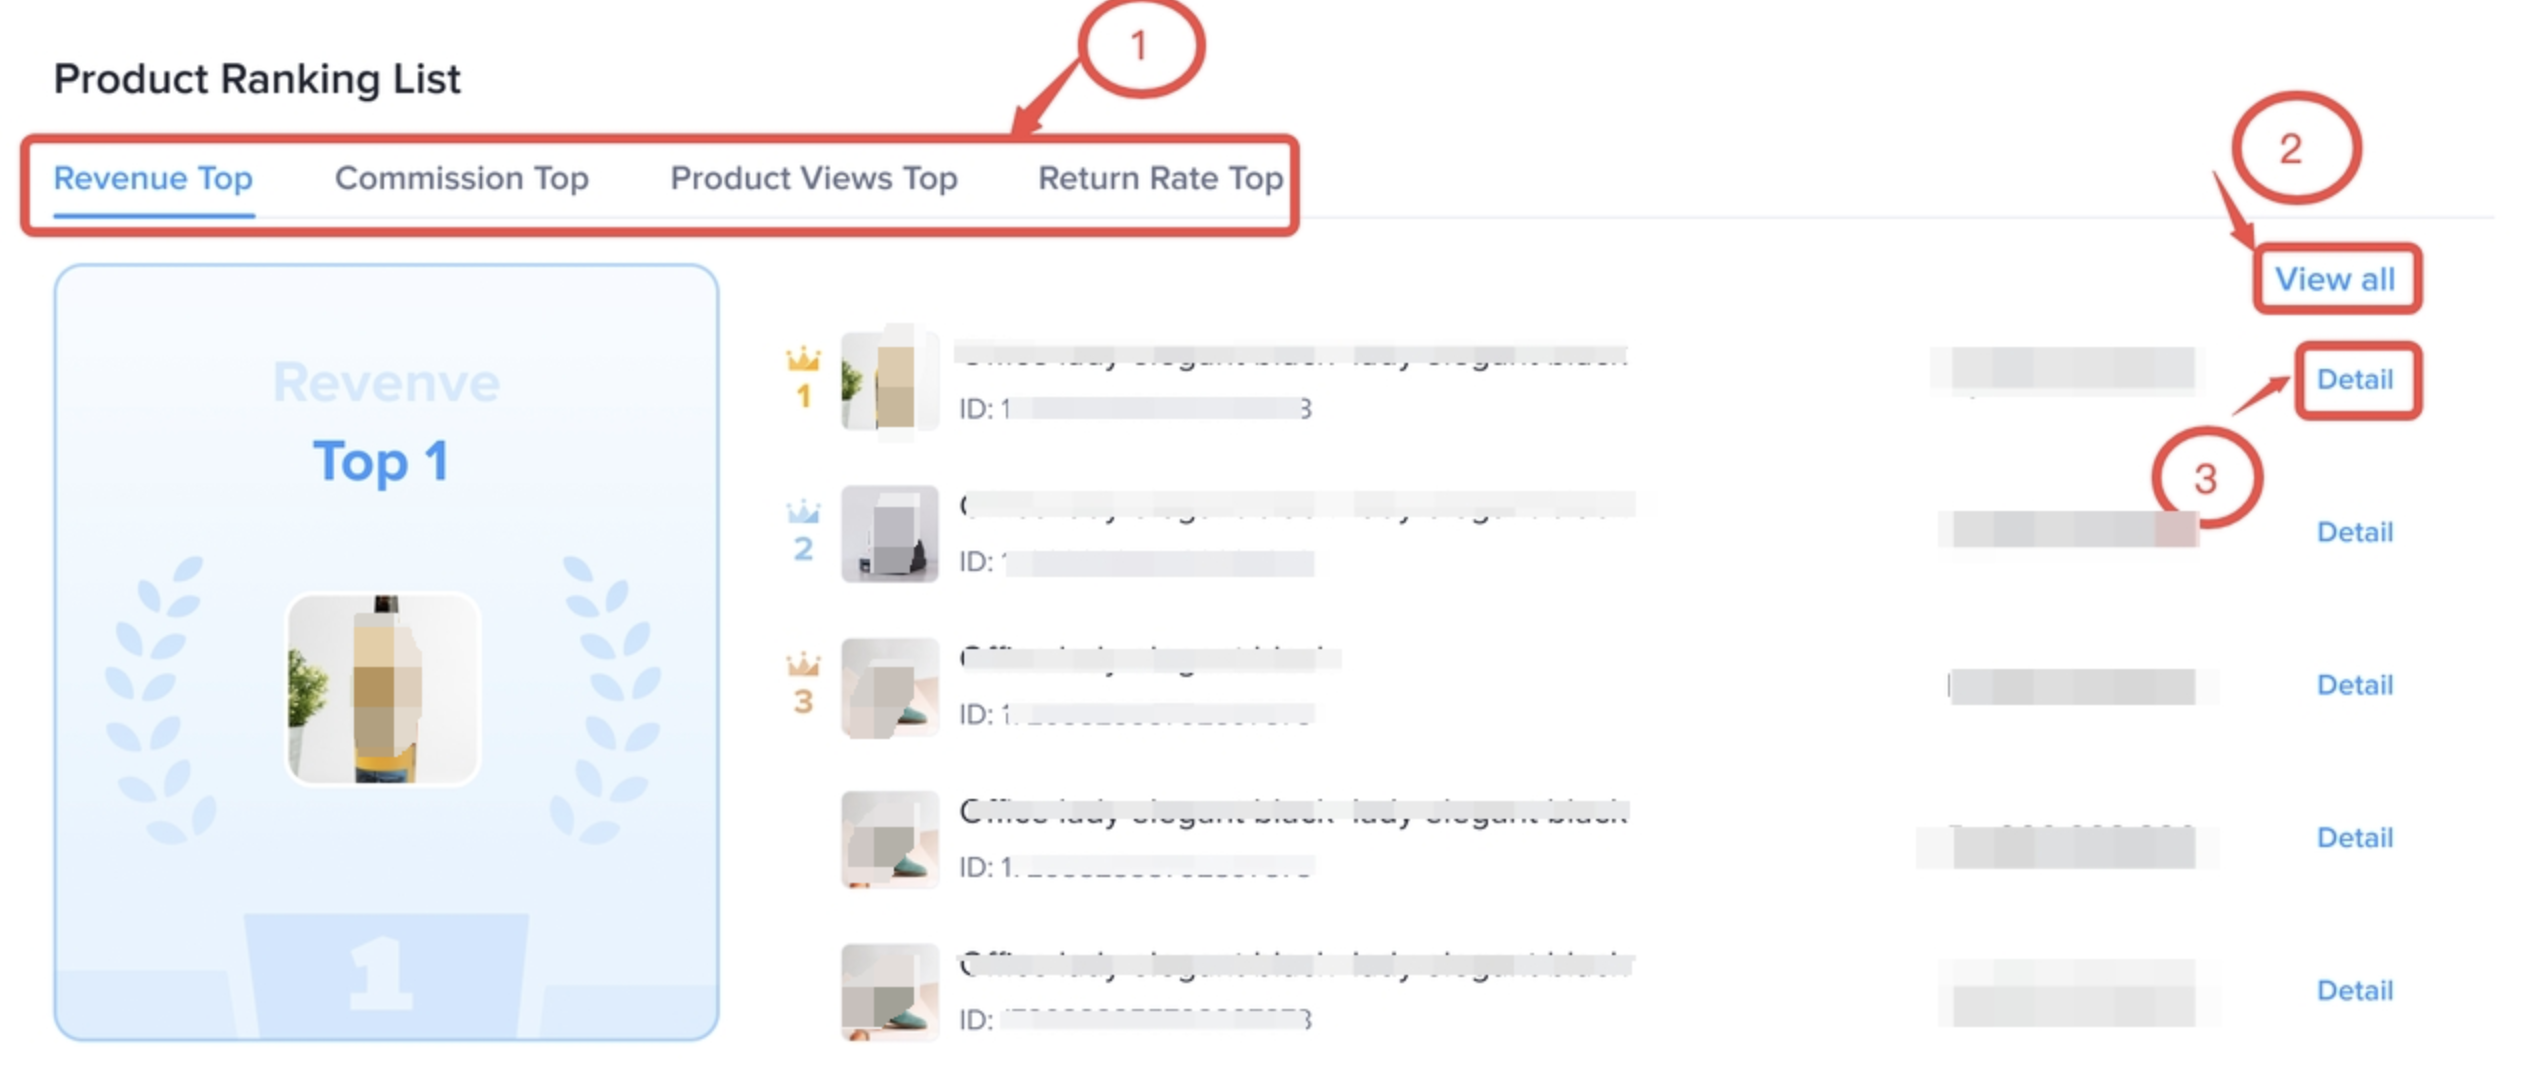
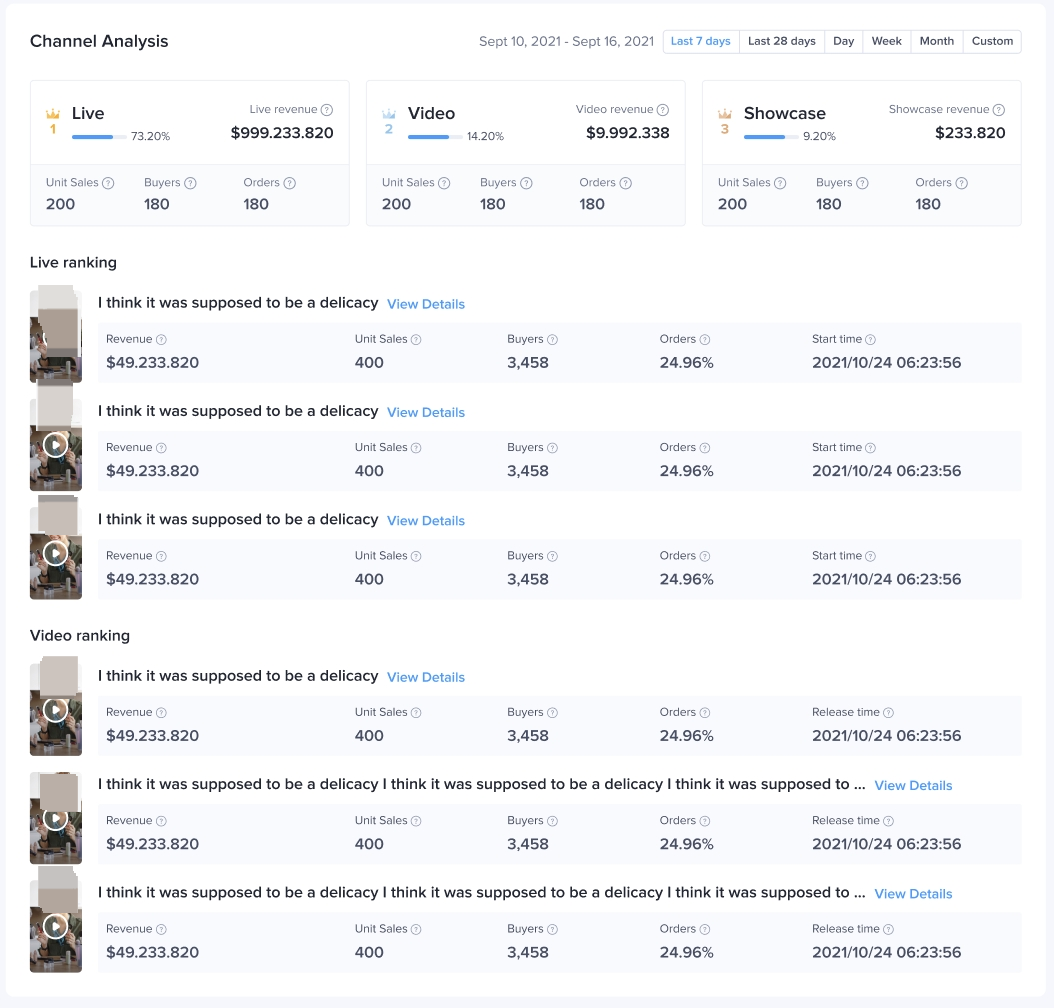
Go to: Streamer Desktop > Data Compass > Product RankingView your product performance based on different dimensions like Revenue, Commission, Product videos and refund rates.
|  |
- Product details
| Product DetailHere you can see all the details about an individual product such as sales status, revenue/refund/traffic and quality indicators of different channels; | 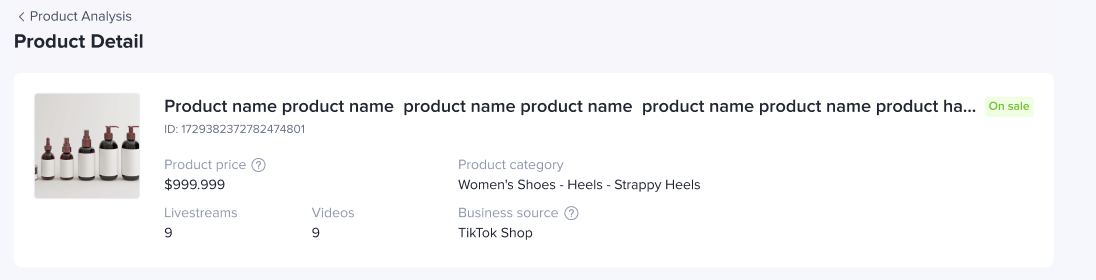 |
| Product performanceHere you can see the details about revenue, refund and traffic performance of products according to all/livestream/video/ window channels. | 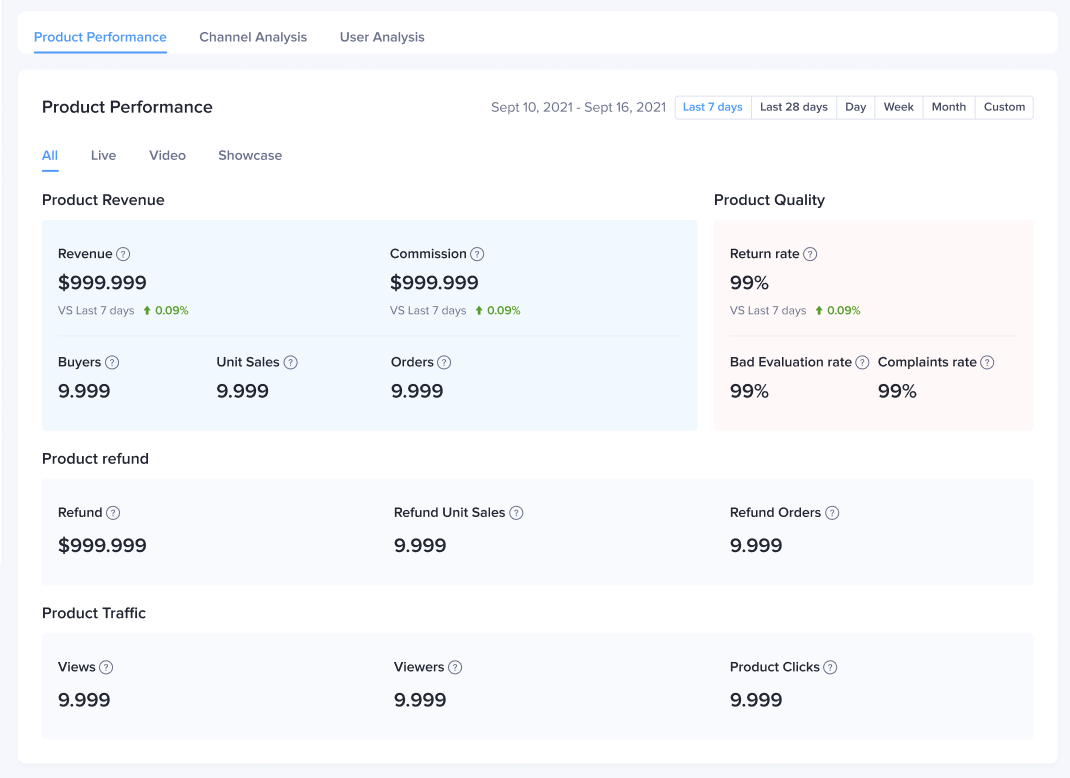 |
Revenue channel analysisView channels according to the revenue amount generated for each product.
|  |
| User conversion analysisHere you can see the number of users and conversion rate for each stage of the conversion funnel including product view - click - revenue. You can also see this data by different channels:User trendsYou can see user trends for each channel type all/live/video/showcase and their activity for view/click/revenue stage.User profileYou can see the demographic data for each channel at every stage of the conversion funnel You can also see a comparison of user profiles in different stages of view/click/revenue. | 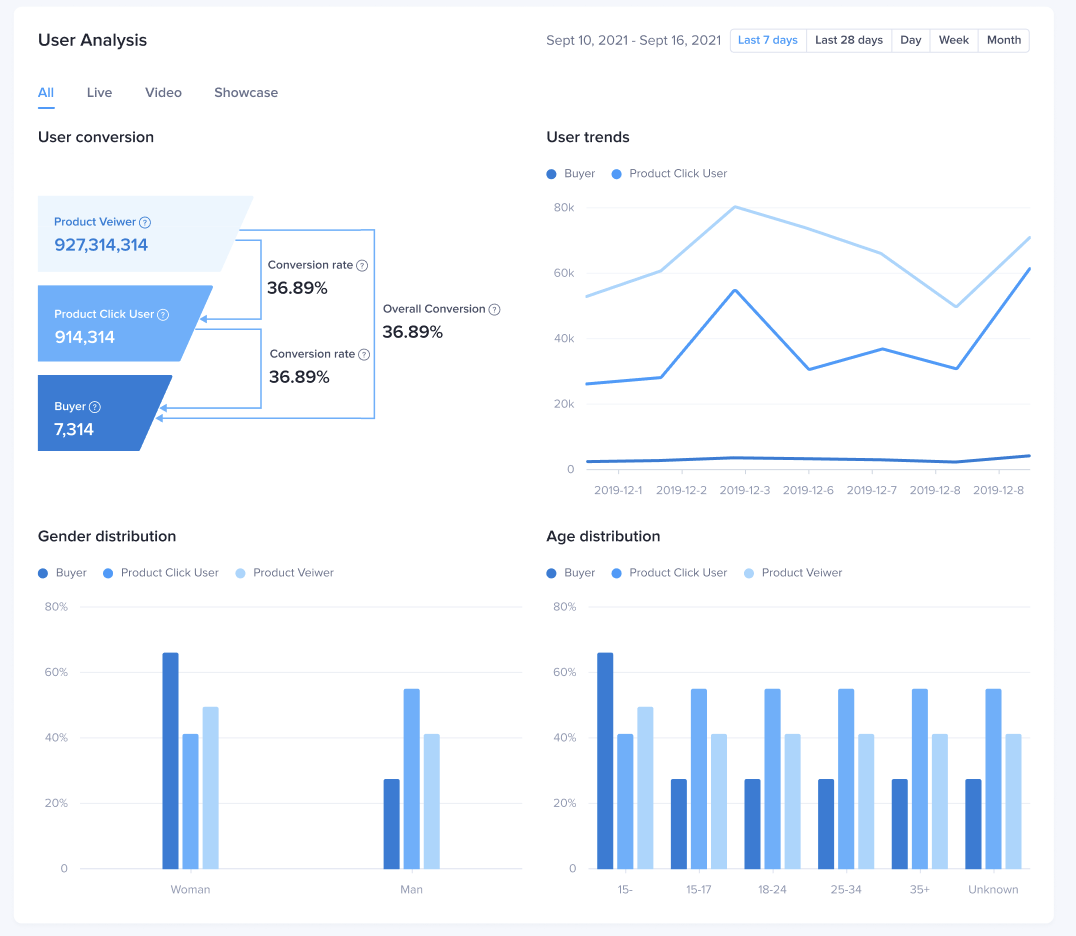 |
FAQ
- Why is there no data for user profile modules and UV indicators when choosing custom time range?
When selecting a custom time range, the user analysis module is not displayed. It is recommended to view the user analysis using a time period of the last 7 days, the last 28 days, day, week, and month.

