

Store Page Analytics
03/25/2024
Do you know your shop's GMV? What about its Visitor count? Familiarising yourself with traffic data is important because not only does it measure your shop's performance, it also gives you actionable insights to improve overall sales.
These crucial numbers can be seen on your Store Page, which refers to any of the five pages: Home, Product, Category, Campaign, and Profile. | Name | Home | Product | Category | Profile |
| Picture | 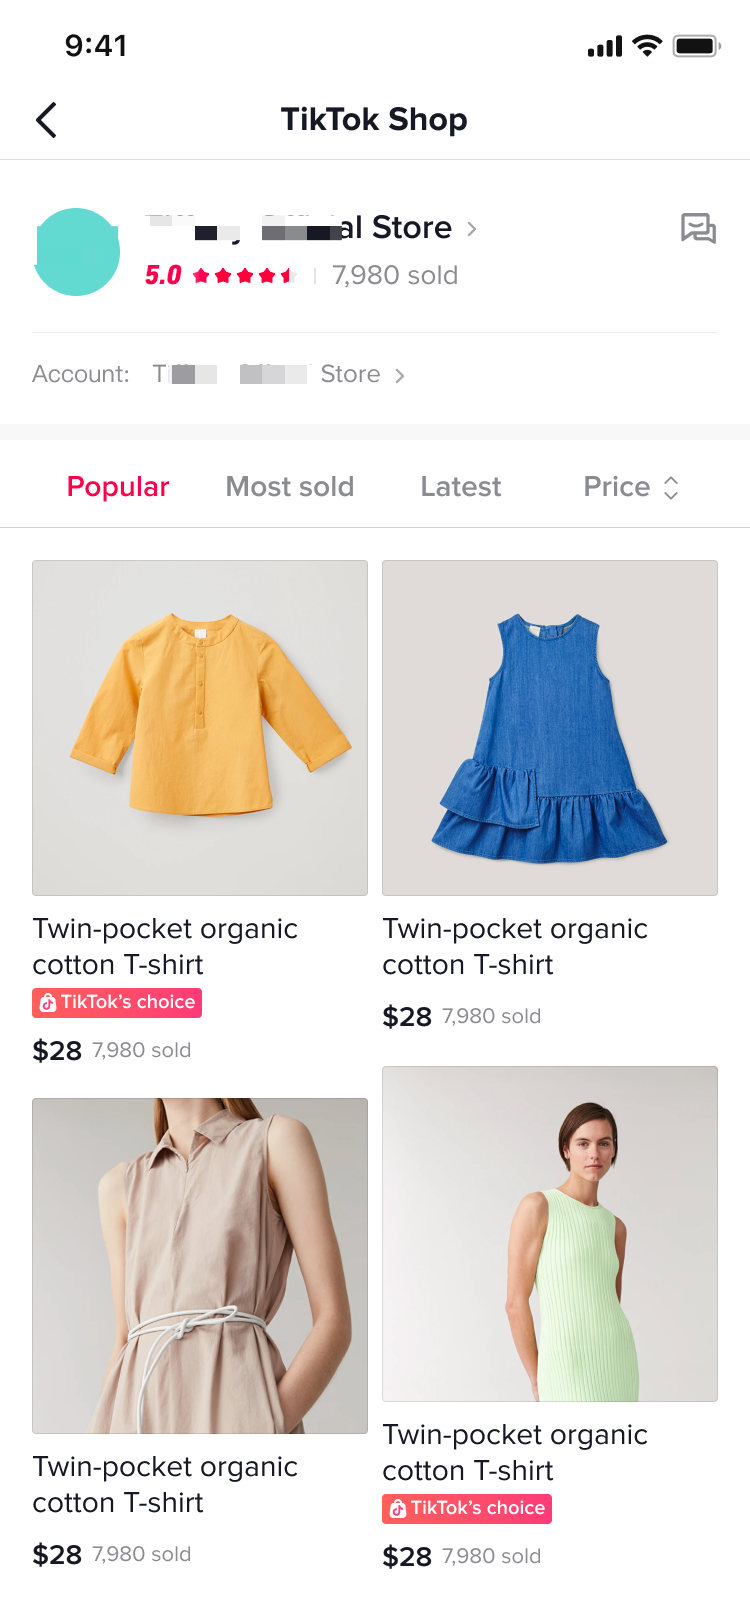 | 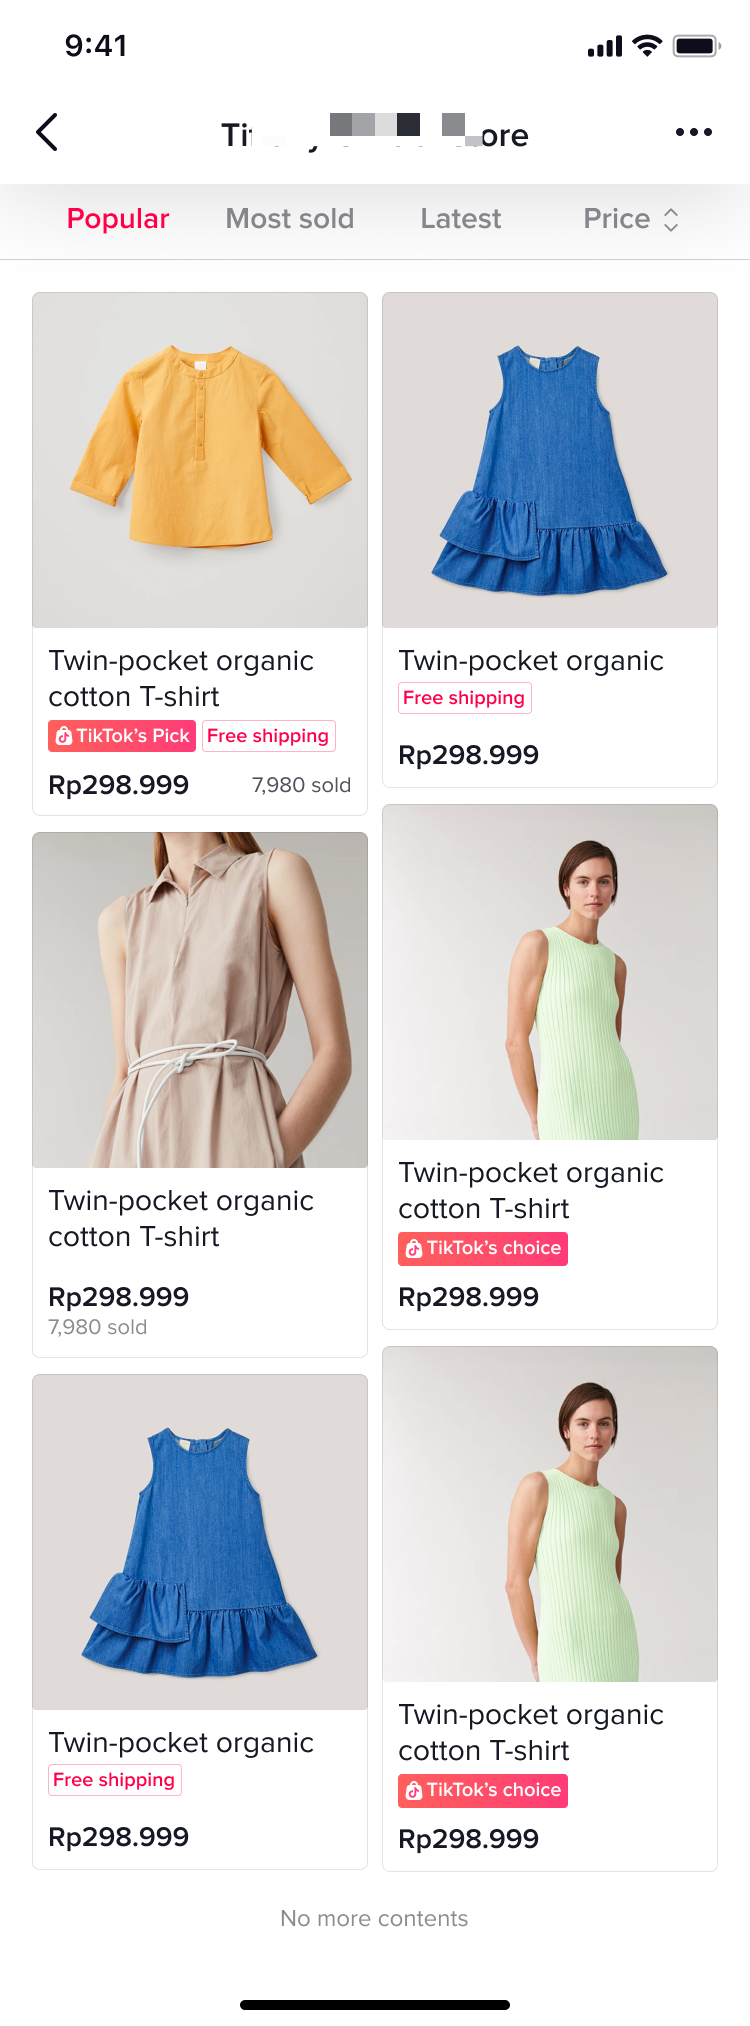 | 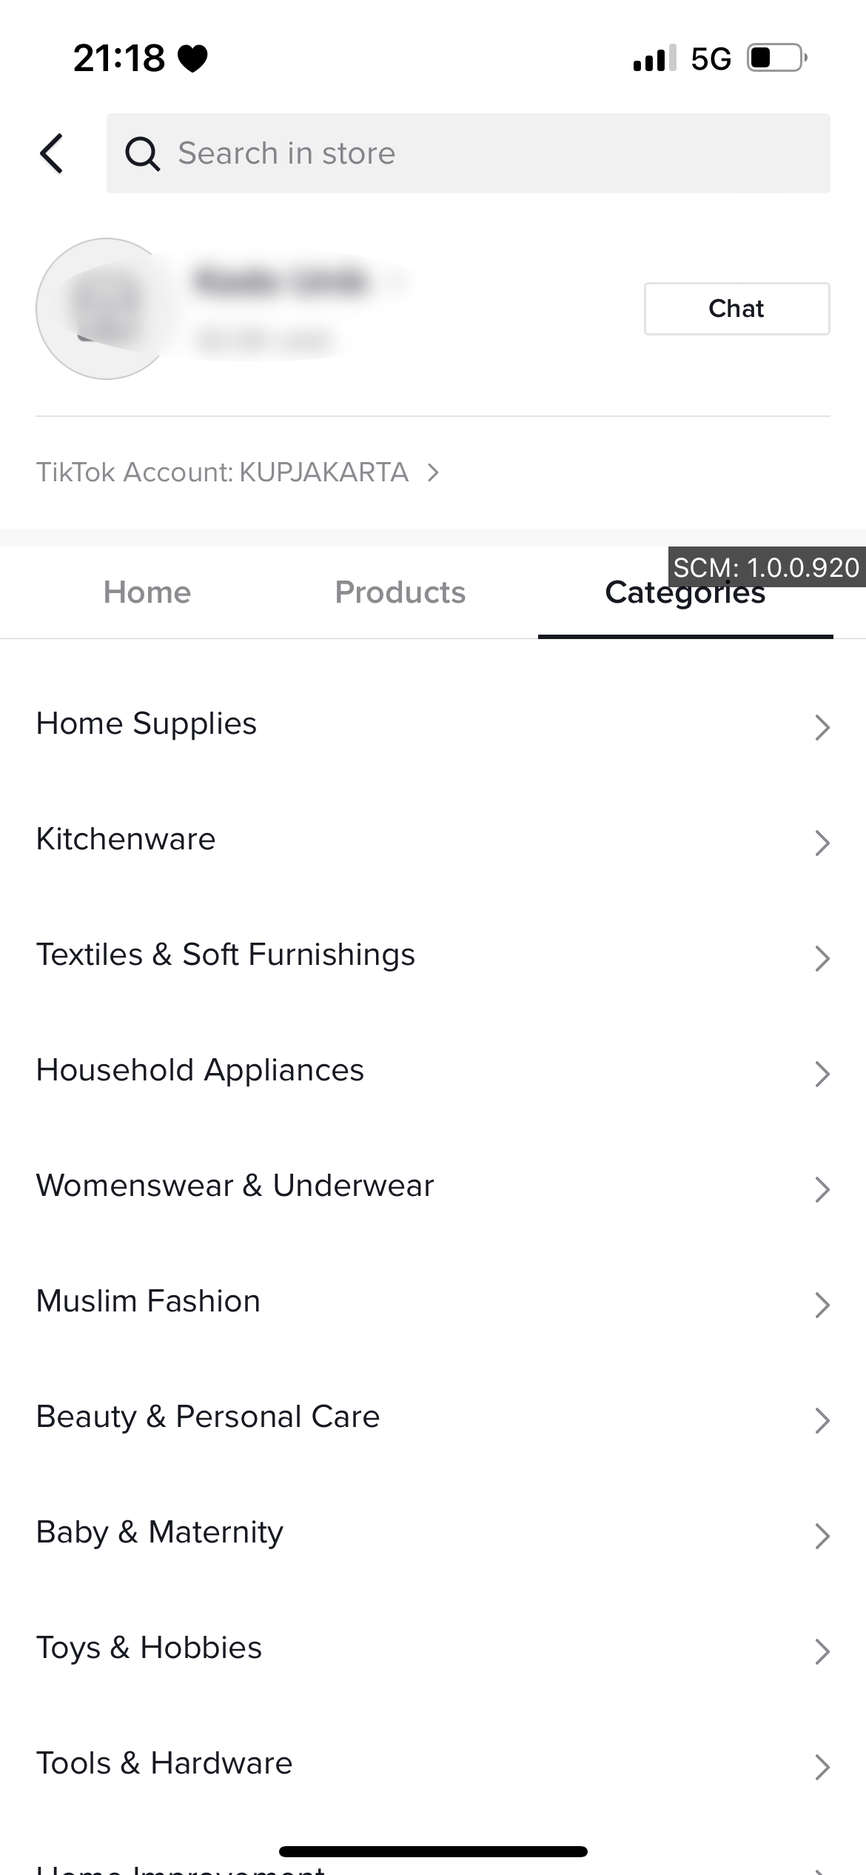 | 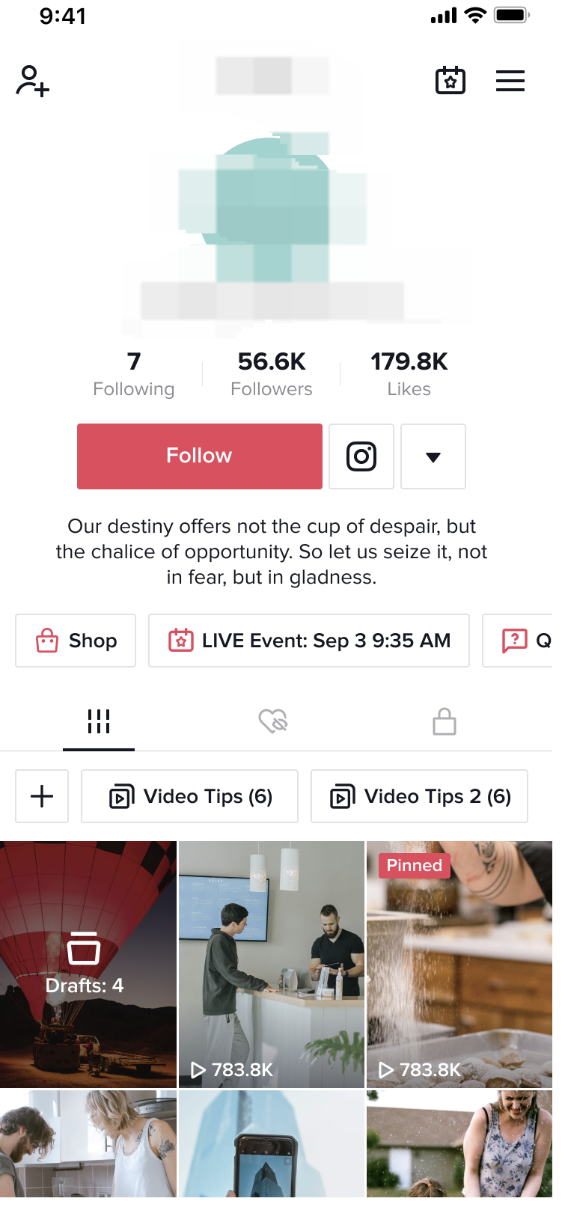 |
Two Ways to Access Your Store Page's Performance Data
1: Overall Performance
Upon accessing the Store Page Performance tab, you'll see the core traffic and sales data. Besides, there are numbers showing the attractiveness of your Store Page through indicators such as Avg. Visiting Time and Avg. Product Clicks.
At the same time, you can examine your shop's trends during a selected time period, as well as the data fluctuation compared to the previous period. How does this info help you?
It gives you an overall look into the health of your Store Page, and allows you to take targeted actions. For example, you realise users aren't staying on your page long enough, which you can improve by making your store more enticing through in-house design tools.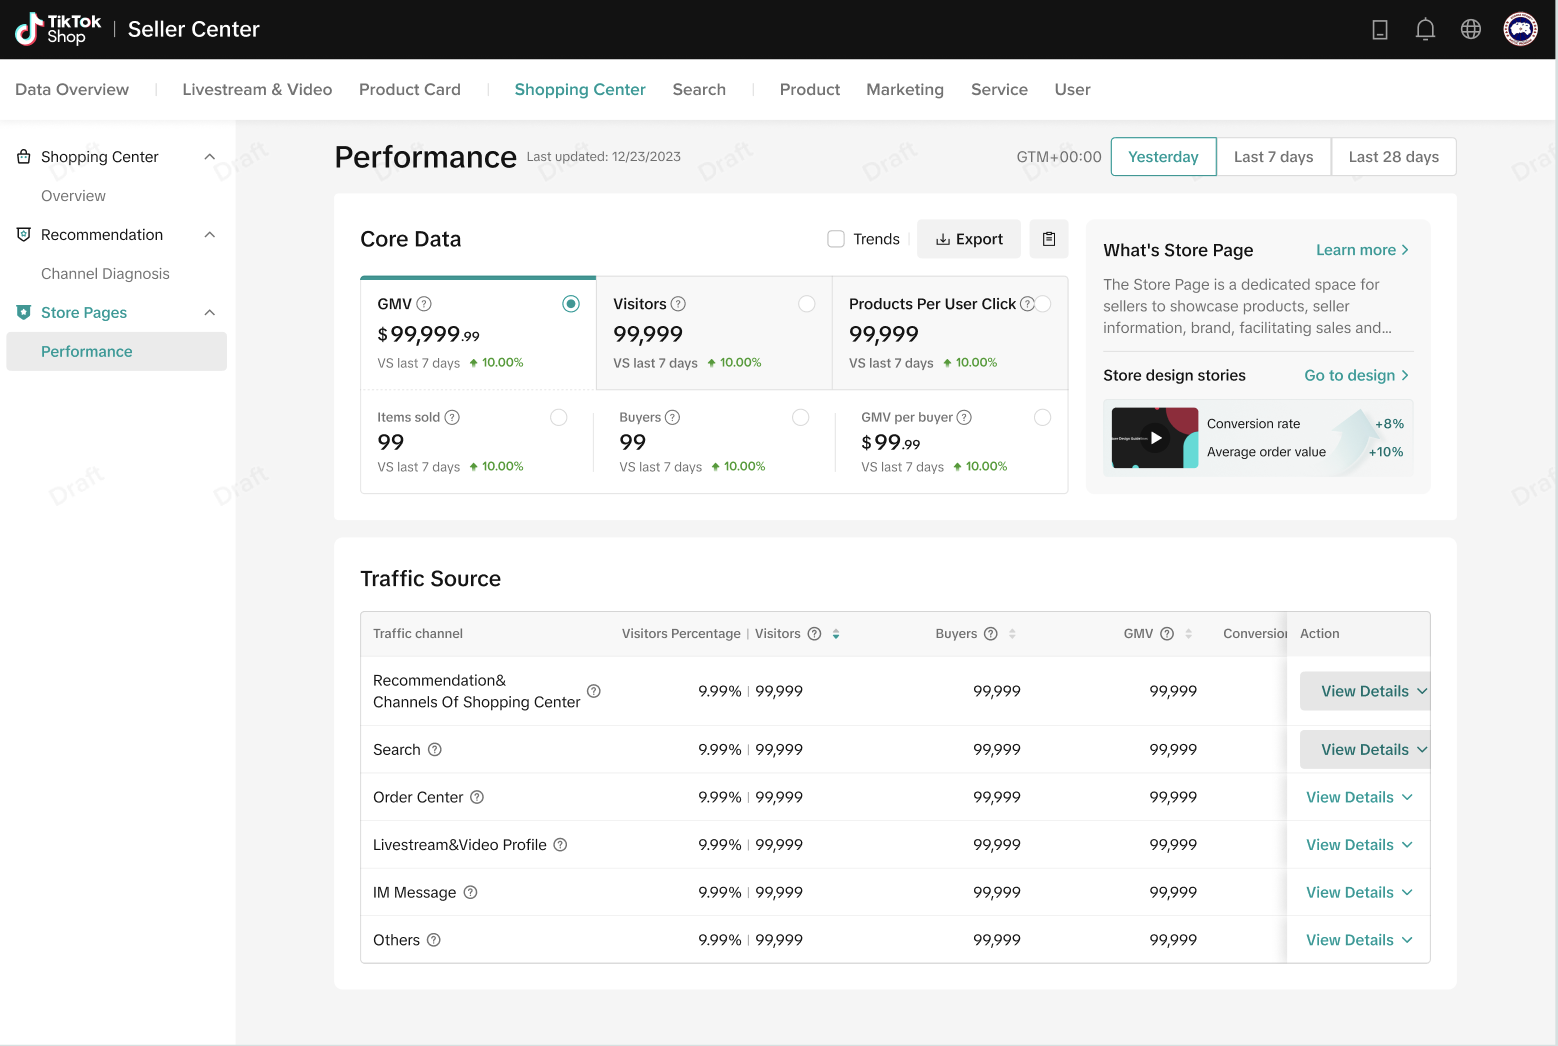
2: Identify Store Page Traffic Sources
Under Traffic Channels, you can identify the channels contributing traffic to the Store Page. These channels can be Search, Order Center, Recommendation, and more. Going into detail, you can also find out the proportion of traffic brought by each channel, whether it's GMV, Conversion Efficiency or Product Click.
How does this info help you?
By understanding the traffic source of each channel, you can identify the ones that require improvement so they can contribute to the growth of your shop.
Core Data Metric Definitions
The Core Data is divided into three metric groups, Sales Indicators and Traffic Indicators. These are their definitions.Sales Indicators:
- GMV: The amount of paid orders directly from the store page during the selected time period, including refunds and returns.
- Items Sold: The number of items for paid orders directly from the store page during the selected time period, including refunds and returns.
- Buyers: The number of unique customers who paid for orders directly from the store page during the selected time period, including refunds and returns.
- Avg. GMV: GMV divided by Buyers. It represents the average amount paid by each customer for orders directly from the store page during the selected time period.
Traffic Indicators:
- Visitors: The number of unique customers who visited your Store Page during the selected time period.
- Page Views: The number of views on your Store Page during the selected time period.
- View to Click Rate: The percentage of unique customers who clicked on products after visiting your store page during the selected time period.
- Click to Paid Rate: The percentage of buyers divided by unique customers who clicked on products on your Store Page during the selected time period.
In-Depth Indicators:
- Avg. Product Clicks: The average number of product clicks per customer during the selected time period.
- PV/UV:Page Views divided by Visitors. It represents the average number of page views per visitor to your store page during the selected time period.
- Avg. Visiting Time: The average visiting time per visitor on your Store Page during the selected time period.

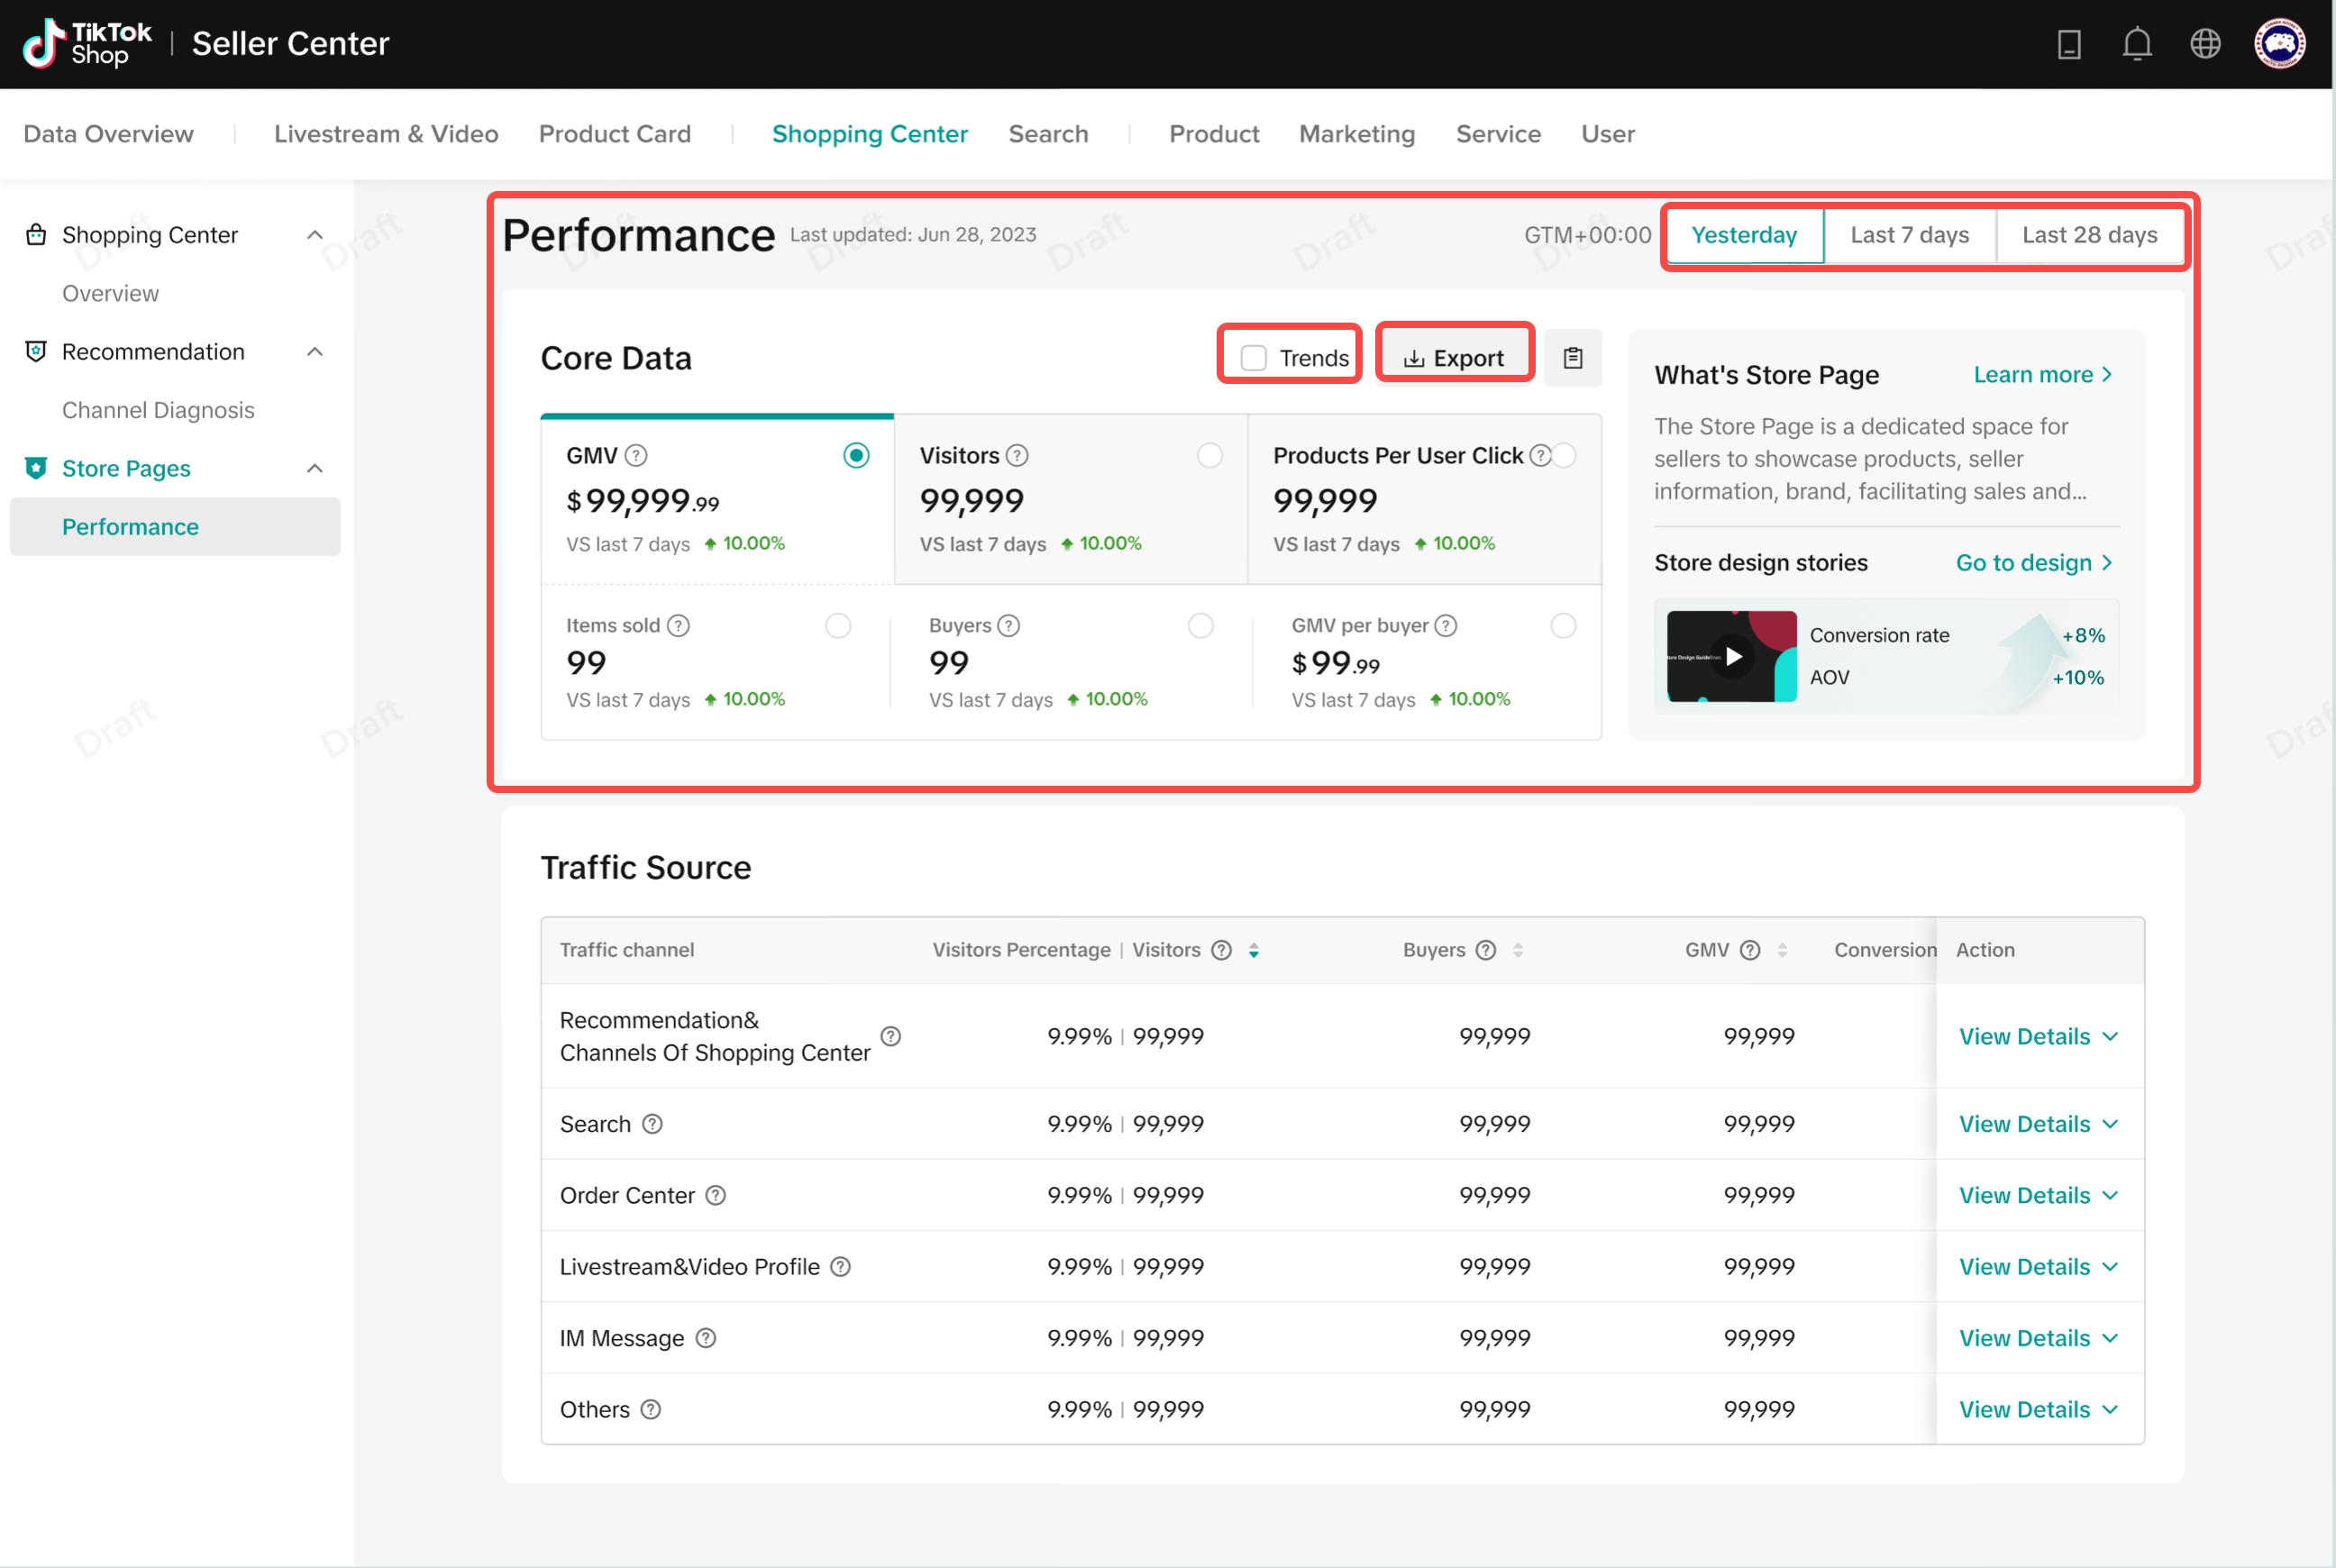
How To Examine Your Store's Performance
You can measure performance by comparing indicators between time periods under the Shopping Center tab:- Input the time period with options Yesterday, Last 7 Days or Last 28 Days
- Click on Trend to view the trend changes of the selected indicators within the chosen period.
- Click on Export to download the indicator data.

Traffic Channels: How They Look Like And What They Mean
| Channel Name | Recommendation and Channels on Shopping Center | Search | Order Center | Livestream and Video Profile | IM Message | Others |
| Definition | Click on the product card of Recommendation or Channels to enter the product detail page, and then enter the store from the product detail page. | Click on the search result to enter the store, including the search on the top of TikTok homepage and the search on the Shopping Center. | Click the store name in the order information to enter the store. | Click on the profile of Livestream and Video, and enter the store from the profile page. | Click on the profile at the top of the IM Message inbox to enter the store. | All traffic resources except the above. |
| Picture |  | 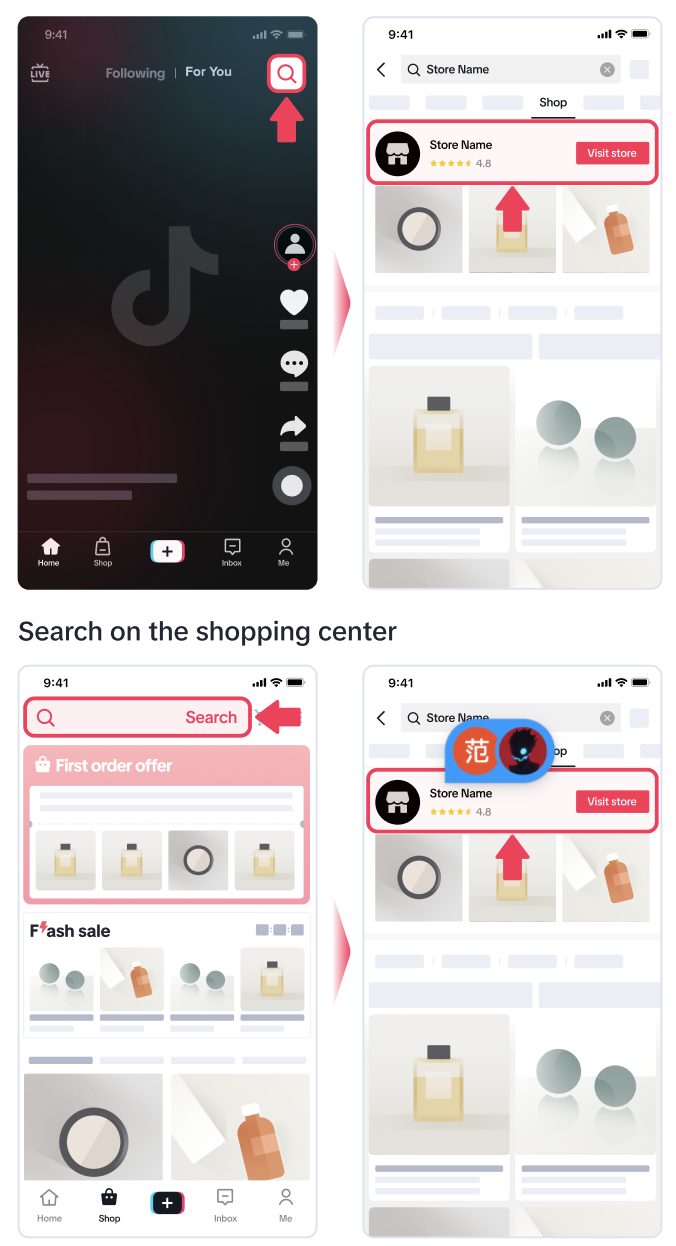 |  |   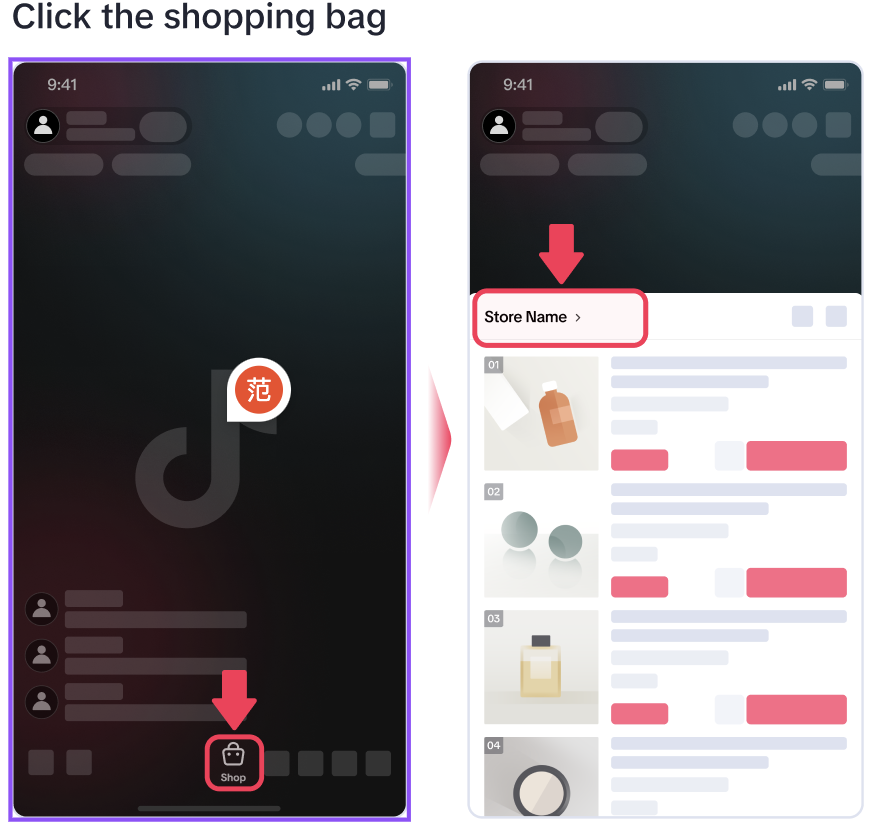 | 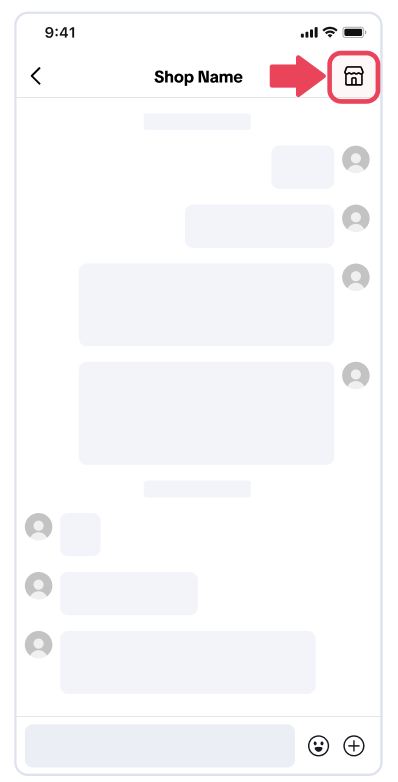 | - |
How To Look For Data Trends For Each Traffic Source
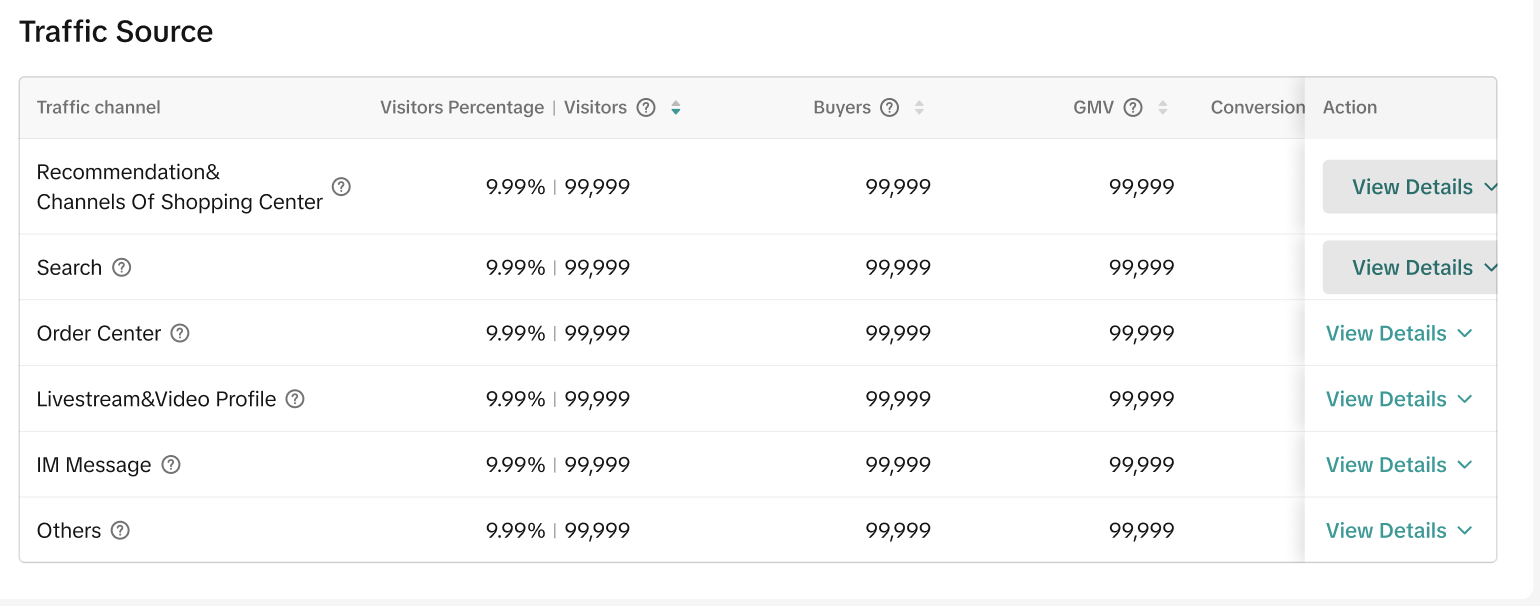
- After clicking View Details, you can see the data trends of the six core indicators for selected time periods and the previous period.

Definitions:
- Visitors: The number of visitors who visited your Store Page from a certain traffic source during the selected time period.
- Visitors Percentage: The percentage of visitors from a certain traffic source divided by the total Store Page visitors during the selected time period.
- Buyers: The number of buyers who entered your Store Page from a certain traffic source during the selected time period.
- GMV:The amount of store pages GMV made from entering your store page from a certain traffic source during the selected time period.
- Conversion Rate: Buyers divided by visitors for a certain traffic source. It represents the percentage of unique customers who paid for orders after entering your Store Page from a certain traffic source during the selected time period.
- Product Per User Click: The average number of product clicks per customer who entered your store page from a certain traffic source during the selected time period.

FAQ
What is the difference between the Store Page and Data Compass?
- Store Page: On top of offering key Traffic Indicators, it also operates the Store Design feature. This means you can use the insights on Store Page to improve the buyer's experience when visiting your Store.
- Data Compass: It focuses on Sales Indicators so you can keep track of your Store's performance in detail.
Can I access my Store Page from Data Compass and vice versa?
- Yes, you can! In fact they're both linked. Tap on Core data under your Store Page's Insights & Tips for a detailed look at performance in Data Compass.
- To quickly access your Store Page from Data Compass, simply click on Store Design.