

Data Analysis via Seller Center App
01/24/2025
Summary
This article teaches you what Data Analysis (via Seller Center App) is and what are the different modules available to help you better evaluate your shop's overall performance. To learn about Data Compass via Desktop/PC, click here.What is Data Analysis?
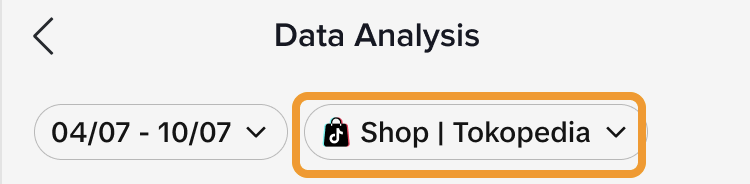
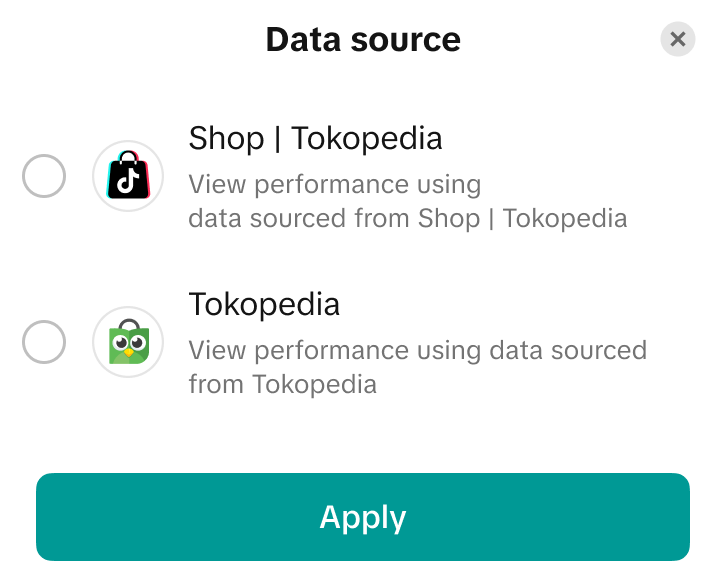
Data Analysis is a page that can be accessed via Seller Center (App) and serves a dashboard for evaluating your shop's performance, offering you a snapshot of key metrics such as sales figures and traffic trends. Additionally, it functions as a gateway to more detailed analytics on performances of your LIVEs, Videos and Products.!! For sellers who are operating on both ShopTokopedia and Tokopedia, please note:| Description | Reference |
|   |
|  |
| |
| |
ShopTokopedia | Tokopedia | ||
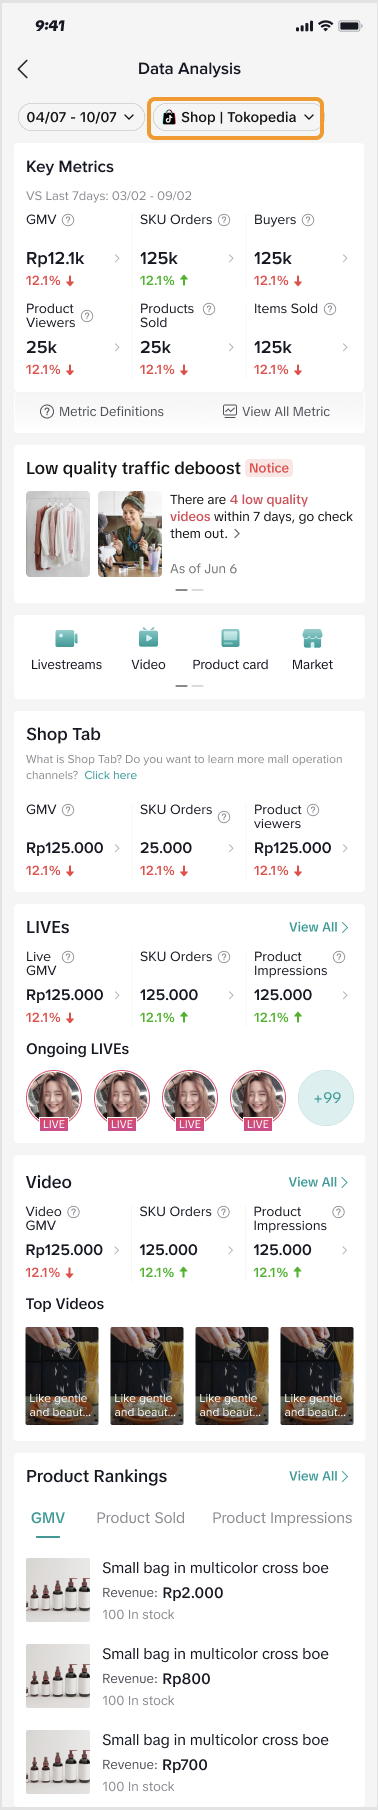 | At the top, you will see:
Modules Available:
| 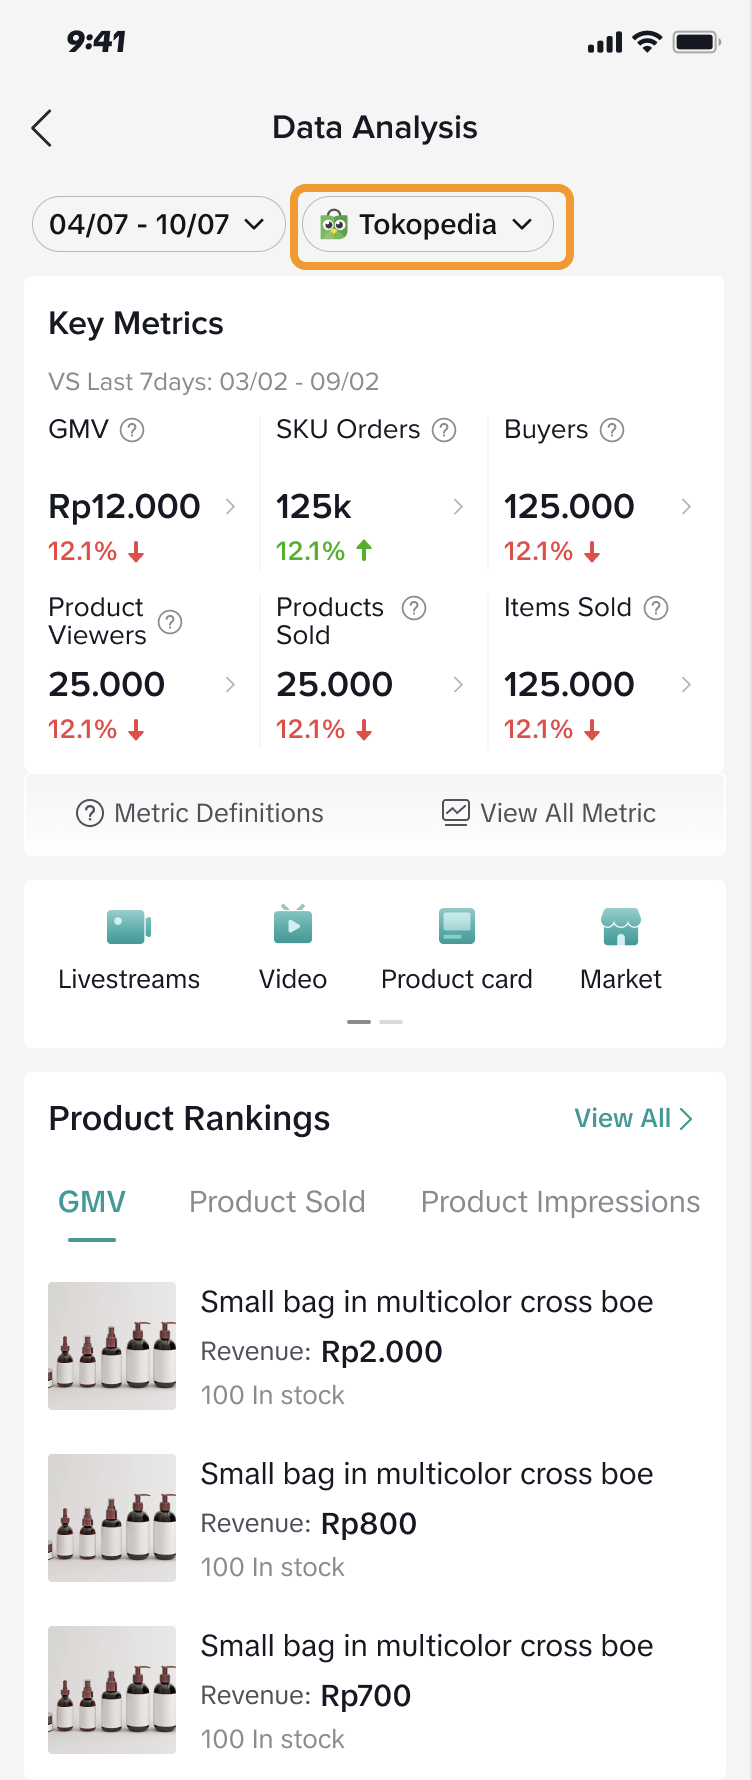 | At the top, you will see:
Modules Available:
|

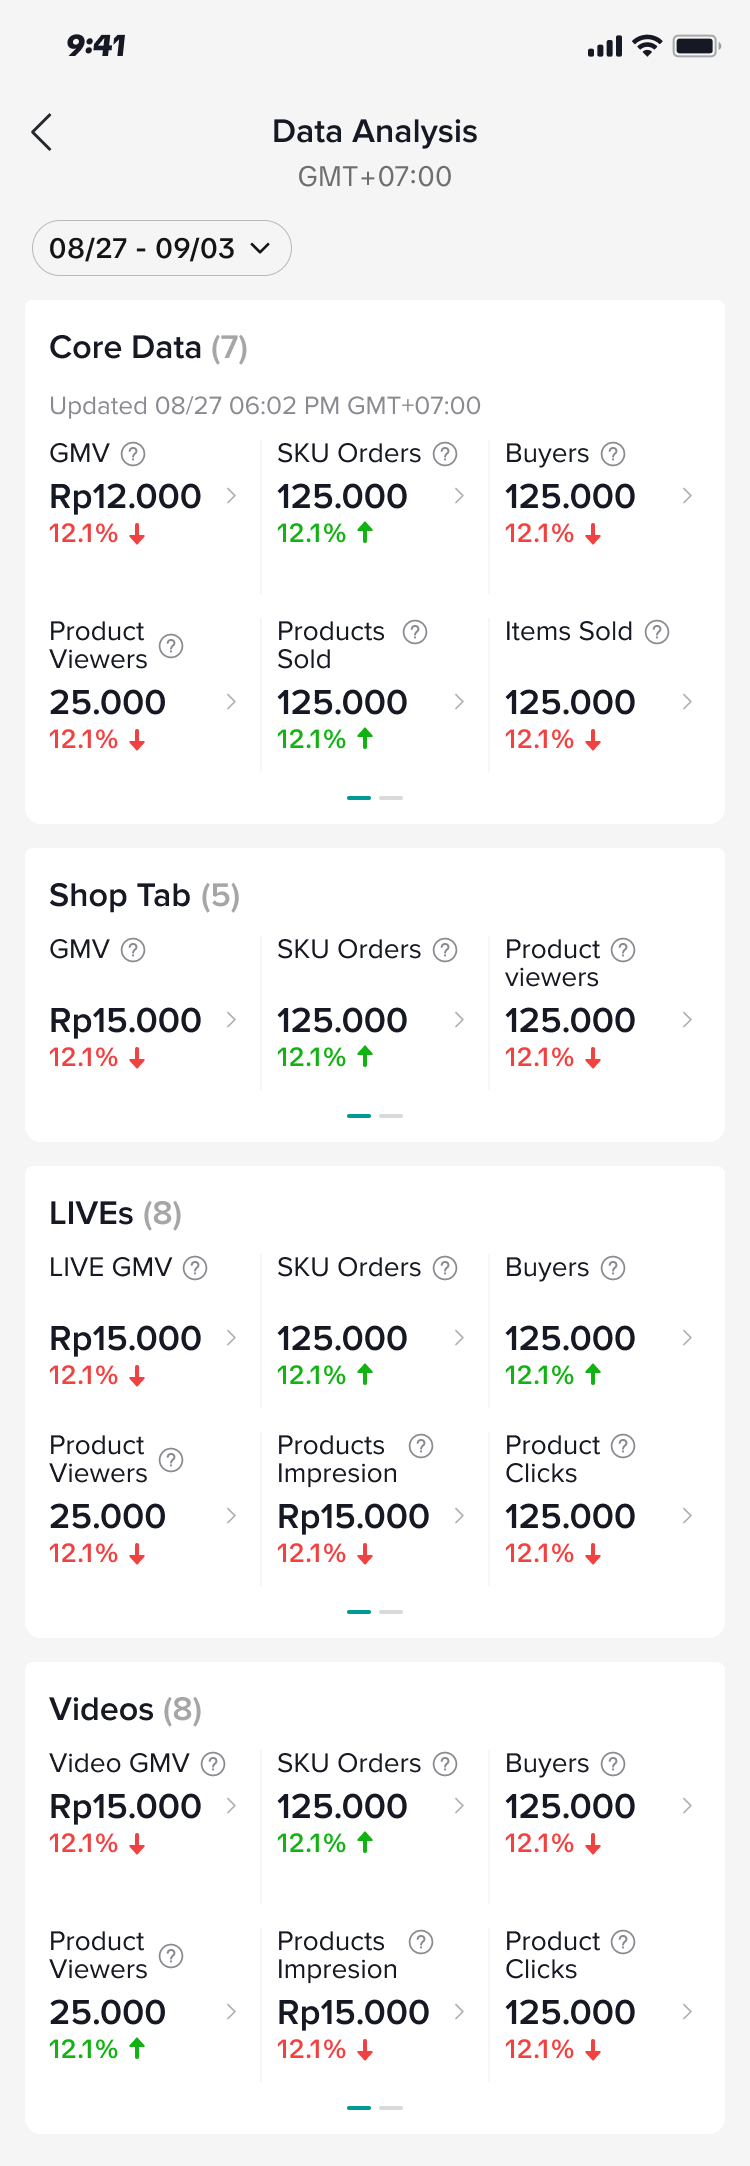
Key Metrics
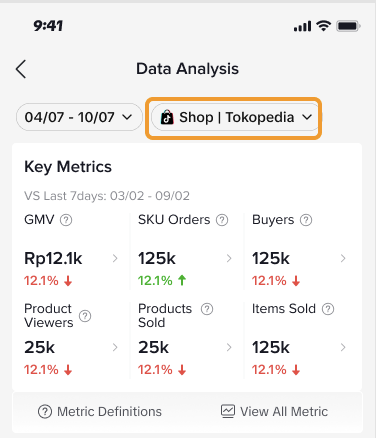 | Here, you can get a quick glance at key performance metrics to understand how your shop is performing during the selected time period:
|
 | Upon clicking on View All Metric, you will be able to see other performance metric categories. Please note, the availability of these performance metric categories may vary depending on the data source filter applied.
|
Diagnosis
 | The Diagnosis banner* alerts you on videos of low quality in the last 7 days. Click into the module to expand the Diagnosis page and get recommended actions you can take to improve your next LIVE. For more information on the Diagnosis page, scroll down to section 3.4 below.*The Diagnosis banner is applicable for ShopTokopedia data only. |
Menu Cards
Use these as quick entry points for you to navigate to a selected module for more insights!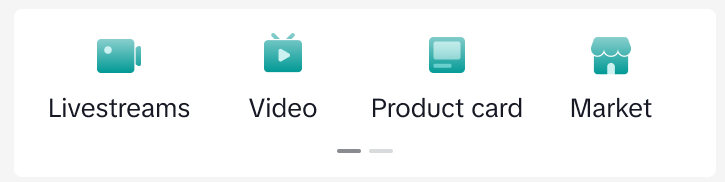 |
|
3.1 Livestreams & Video
Livestream* | Video* |
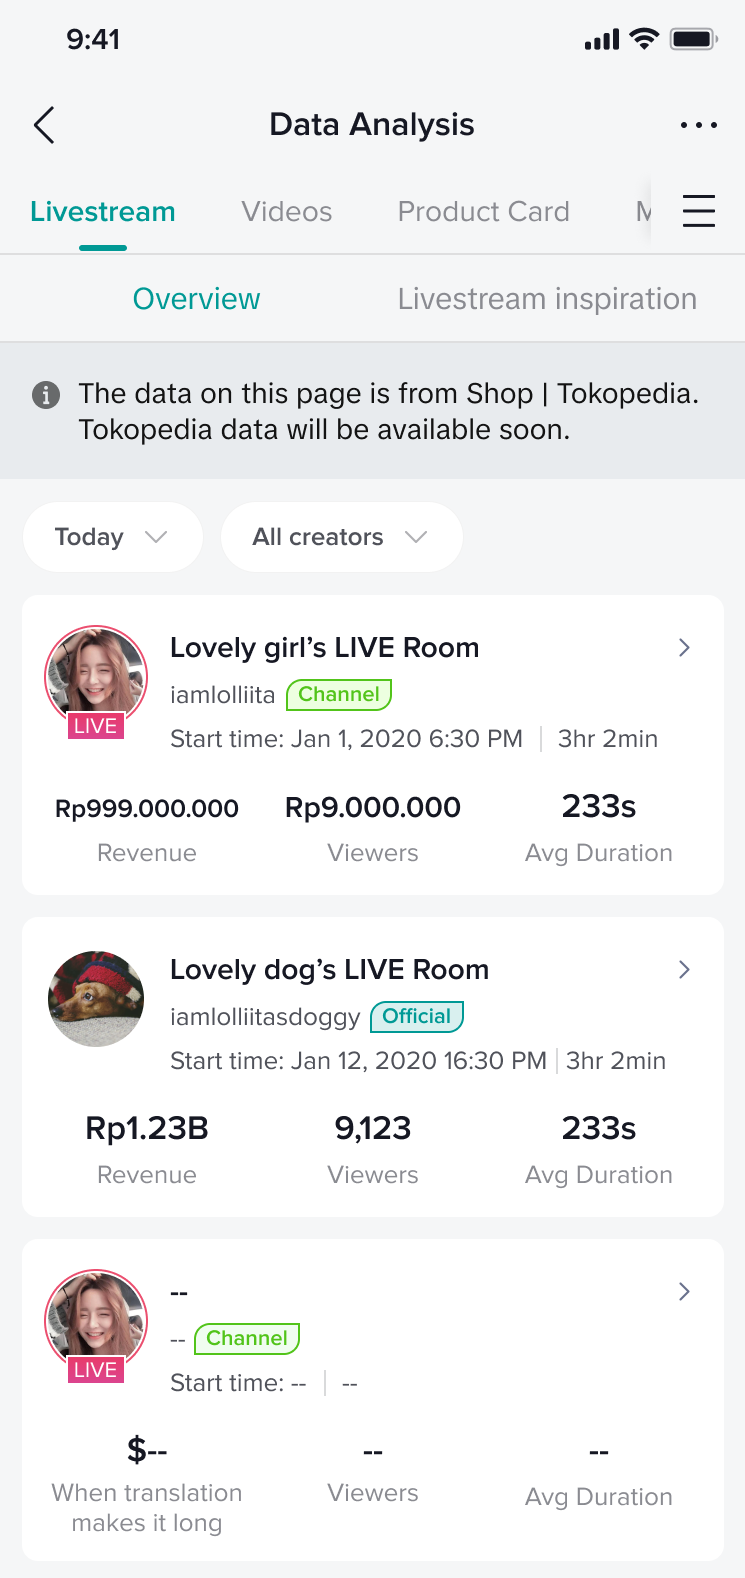 | 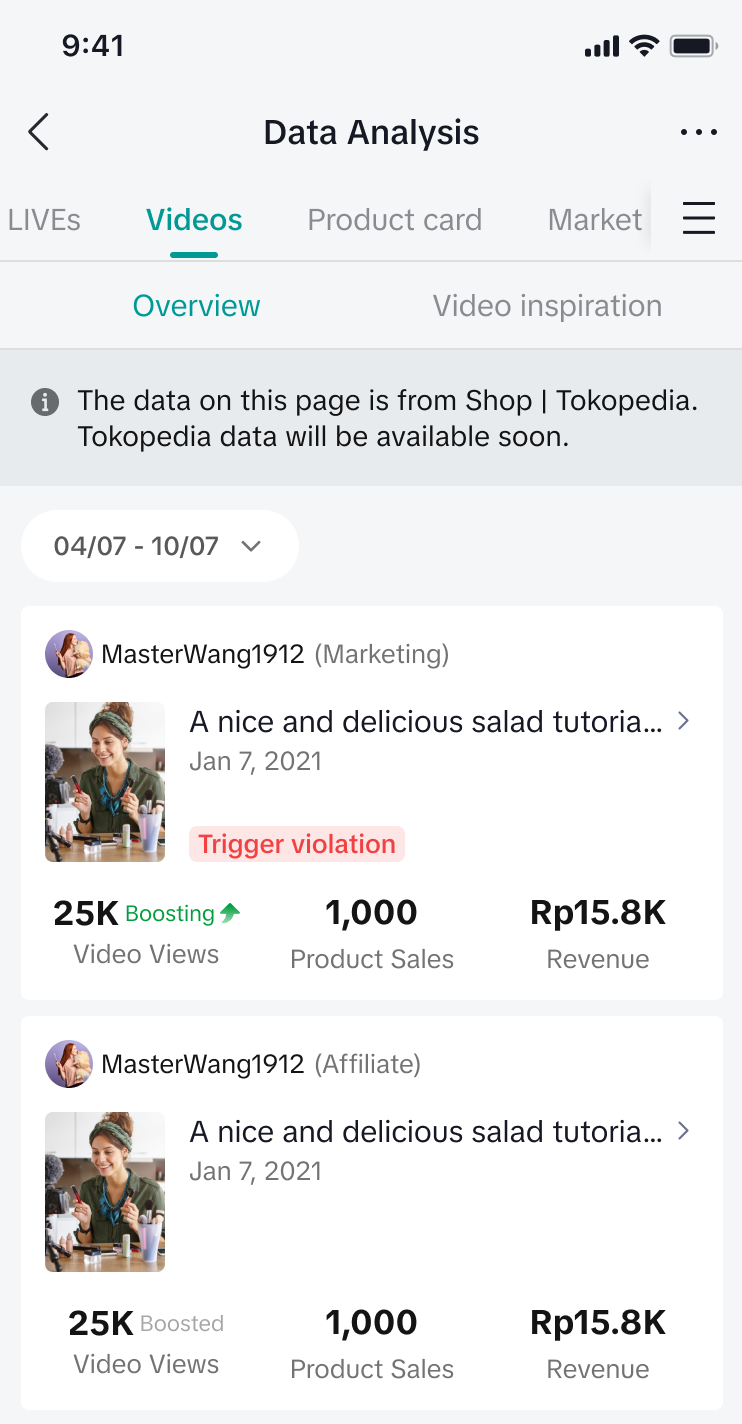 |
| The Livestream page will show you a list of all your LIVEs and each individual LIVE performance such as GMV, Viewers and Average Duration. | The Video page will show you a list of all your videos and each individual video performance, such as Video Views, Product Sales and Revenue. |
*Data shown on the Livestream and Video modules are based on ShopTokopedia only. | |
3.3 Product Card
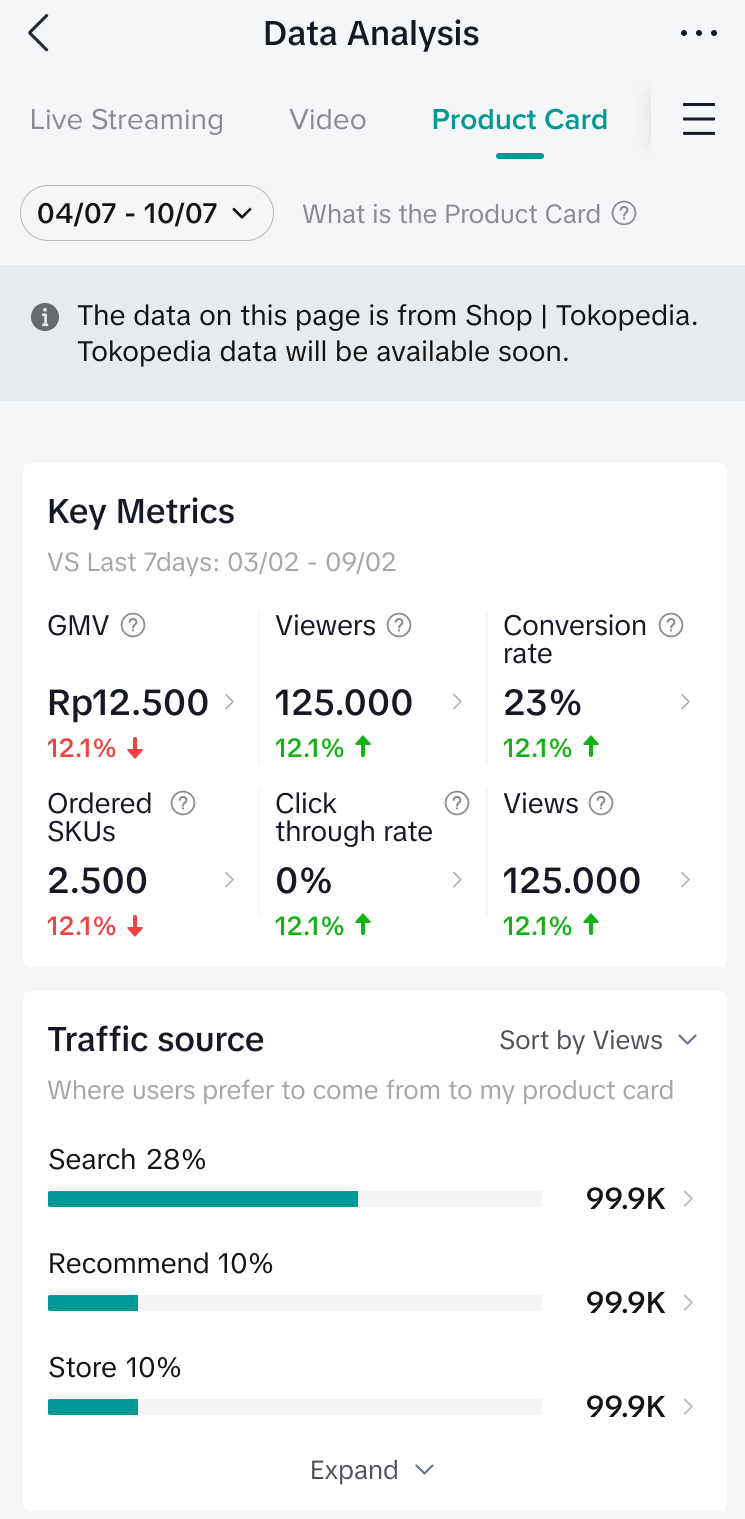 |  |
| The Product Card page* enables you to evaluate Product Card attribution in terms of GMV, Viewers, Conversion rate, Ordered SKUs, CTR and Views. You can also identify where your audience comes from via the Traffic Source section, understanding how user behaviour can help you with targeting more users for higher conversion! | If you would like to learn more about Product Card, simply click on "What is the Product Card" beside the date filter. |
*Data shown on the Product Card page is based on ShopTokopedia only. | |
3.4 Product
| Data Source | Product page | Product Details page | |
| ShopTokopedia | 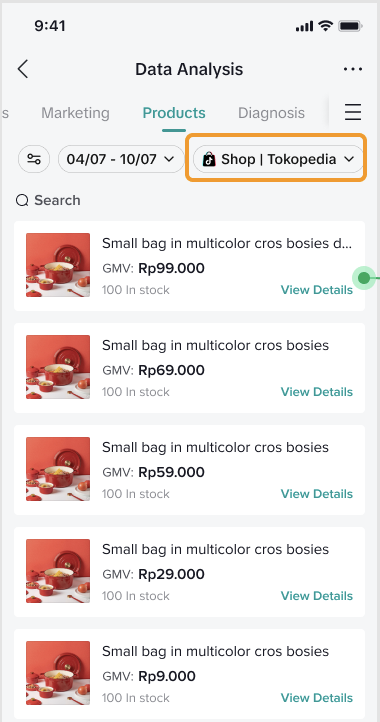 | 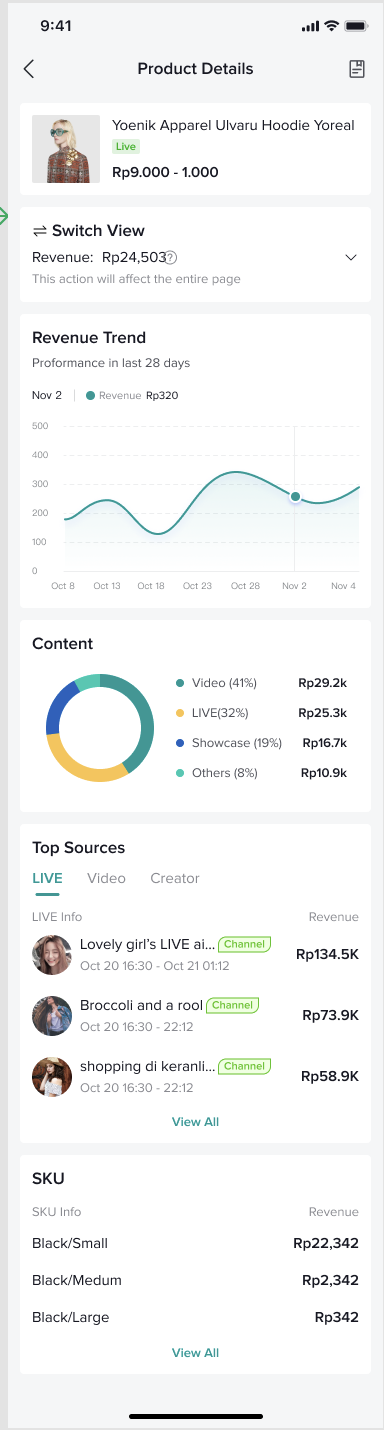 | For ShopTokopedia data, you will be able to analyse the products:
|
| Tokopedia | 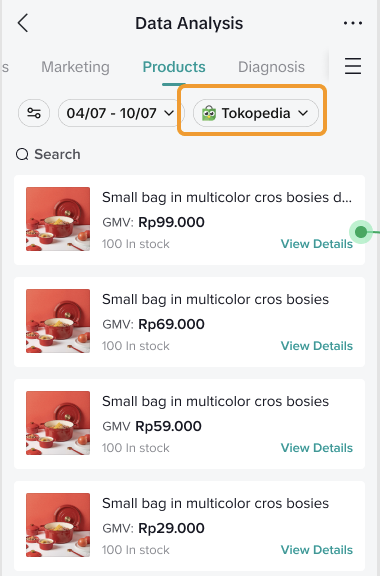 | 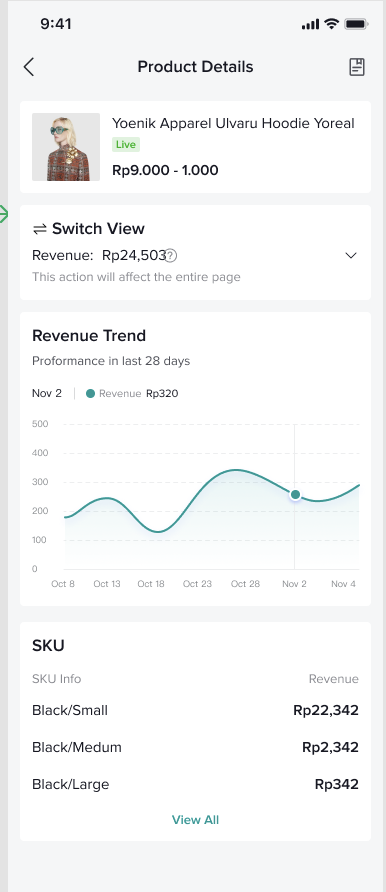 | For Tokopedia data, you will be able to analyse the products:
|
3.3 Marketing
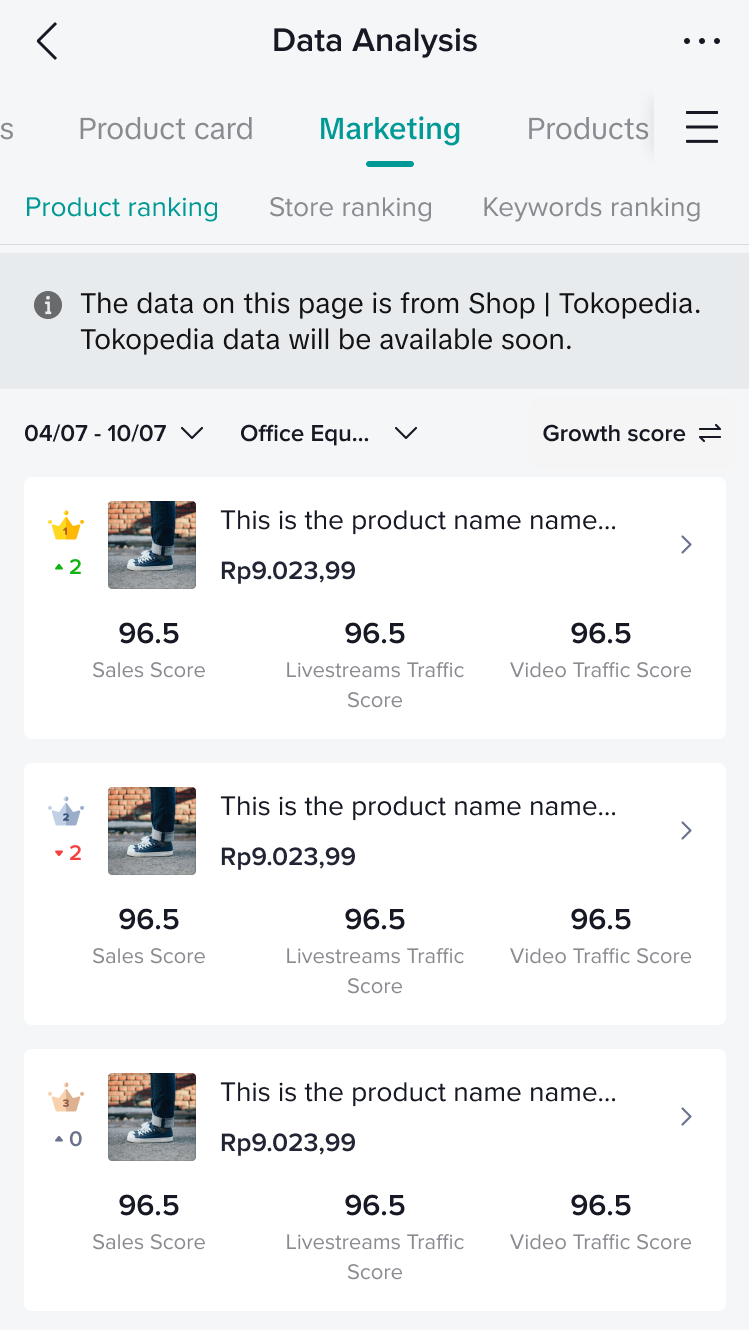 | The Marketing page allows you to get insights from how other products, stores and keywords are performing across the platform. This enables you to stay up to date with what buyers are looking for and optimise your assortment to suit market needs!Here, you can toggle between 3 tabs:
|
| *Data shown on Product ranking, Store ranking and Keywords ranking is based on ShopTokopedia only.Only sellers who have authorised the use of shop data to create the rankings can view the rankings. | |
3.4 Diagnosis
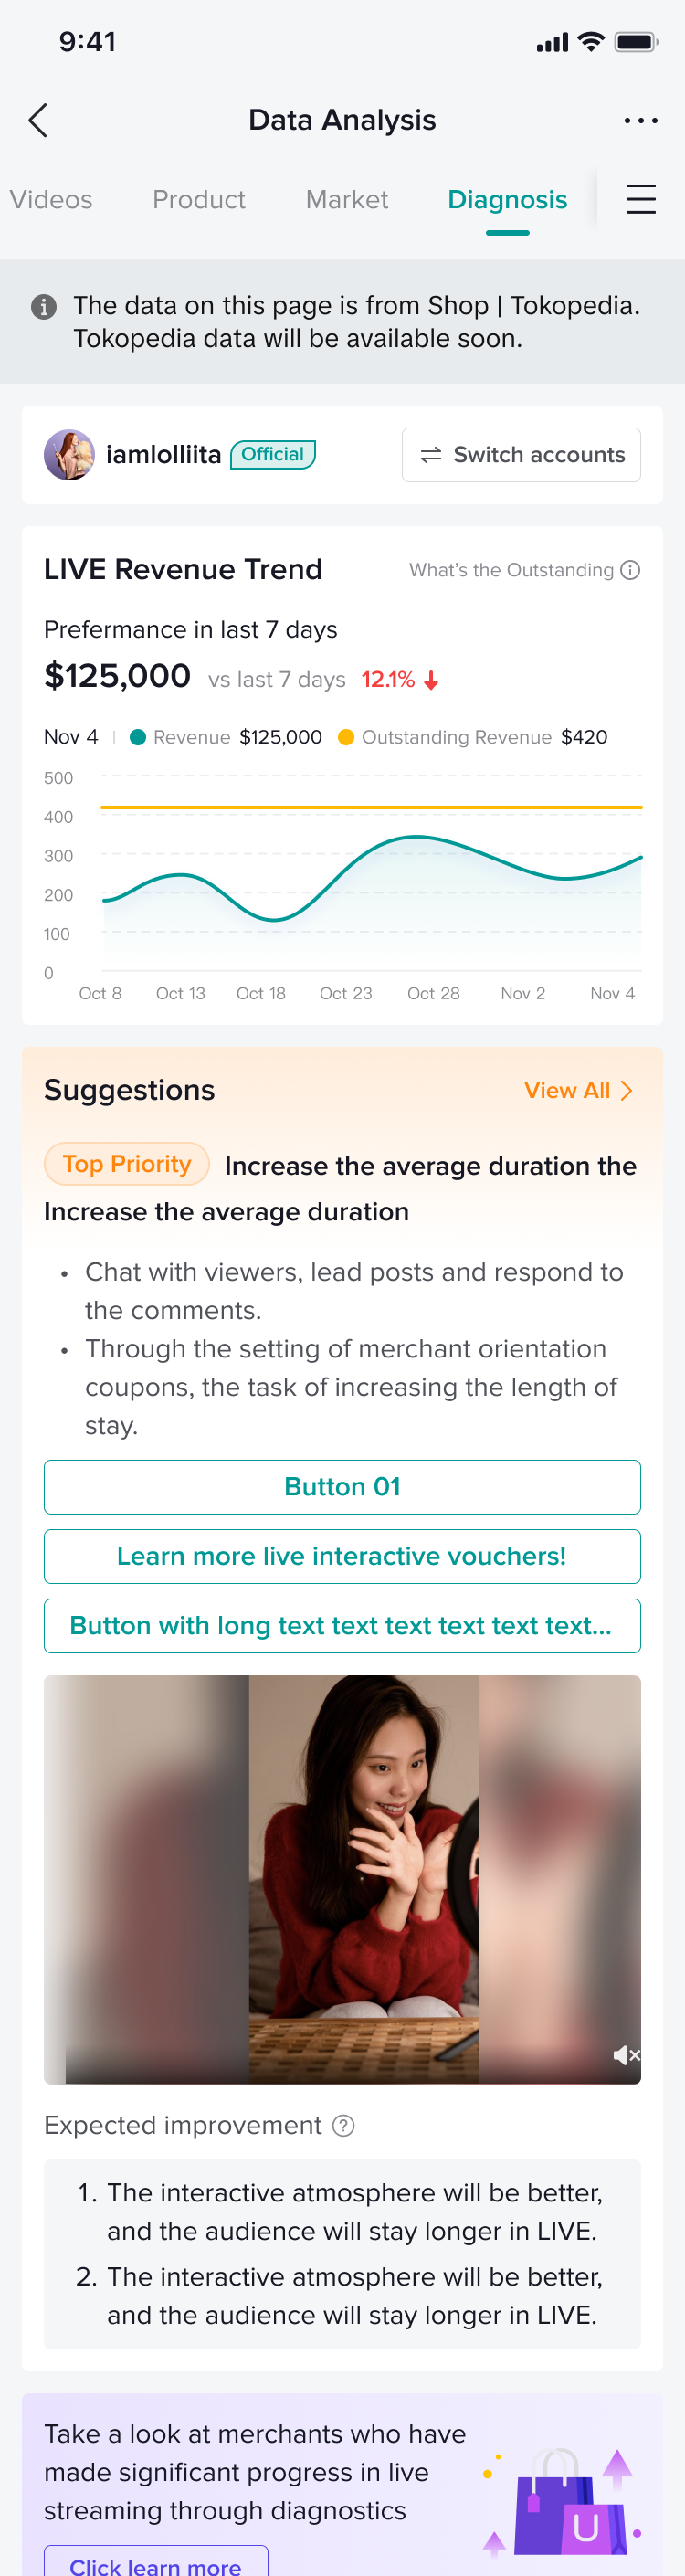 | On the Diagnosis page*, evaluate your LIVE revenue trend from the last 7 days and understand the fluctuations in your GMV performance. What's more, check out how to improve your next LIVE by following the recommended suggestions given.*The Diagnosis page is available for ShopTokopedia data only. |
Shop Tab
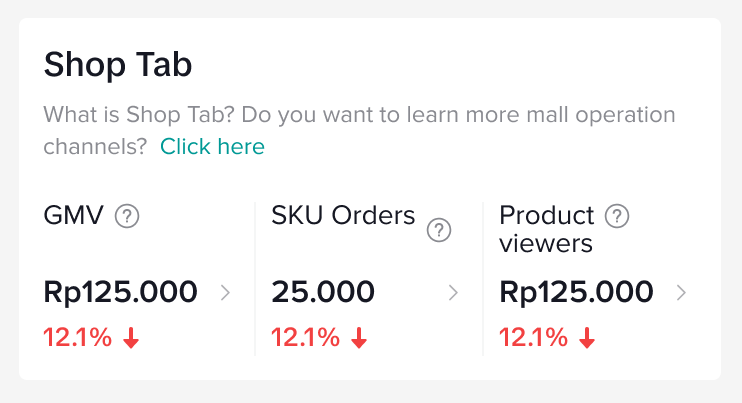 | The Shop Tab module* gives you a quick overview of the attribution of Shop Tab GMV, SKU Orders and Product Viewers.*Shop Tab module is available for ShopTokopedia data only. |
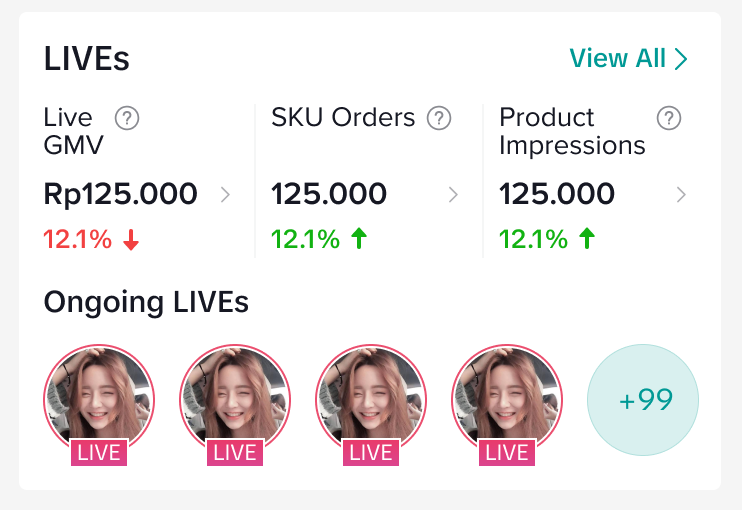
LIVEs
 |
|
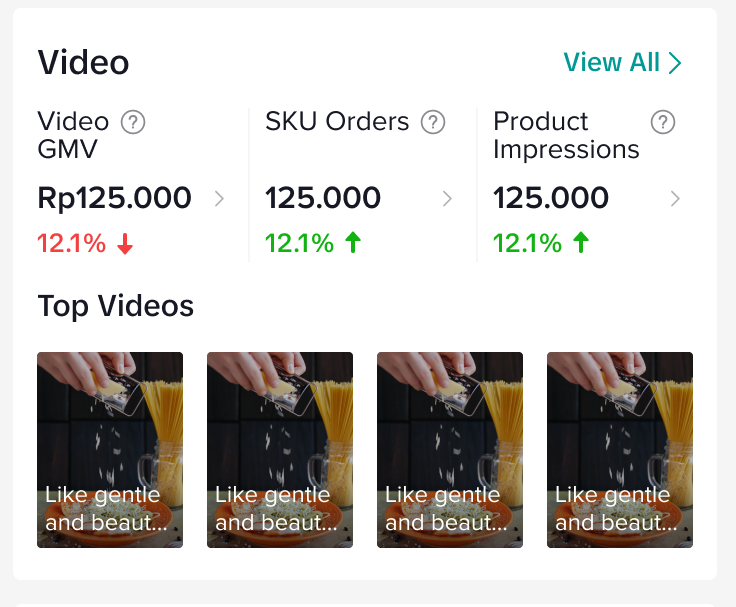
Video
 |
|
Product Ranking
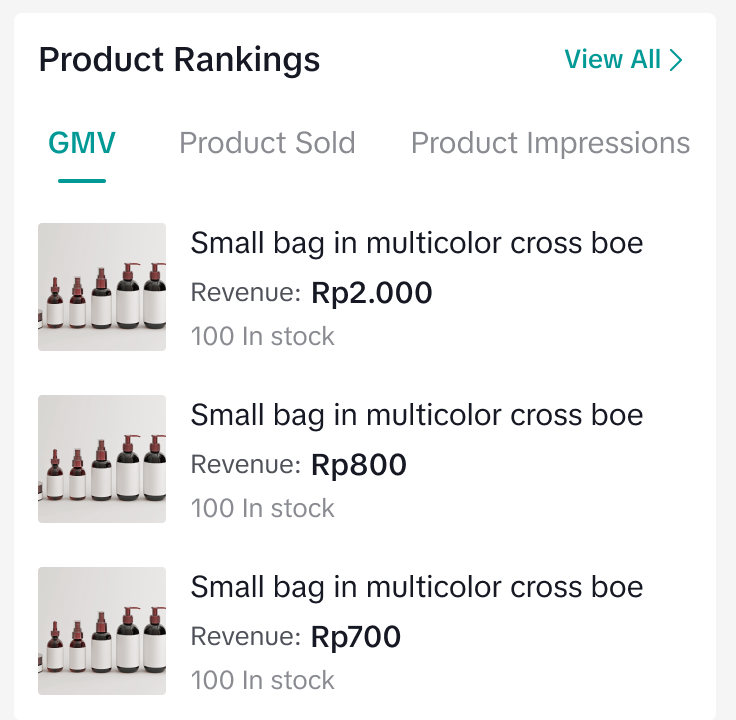 | The Product Ranking** module gives you a snapshot of your Top 3 performing products based on your selected tab:
|

FAQs
- I have integrated my account to ShopTokopedia. Can I still view my performance on Tokopedia (App) after integration?
| Seller Criteria | Tokopedia Seller Analytics |
Seller with the below criteria:
|
|
- What are the Wawasan pages on Tokopedia (App) that will no longer be updated once sellers have completed the full integration process?
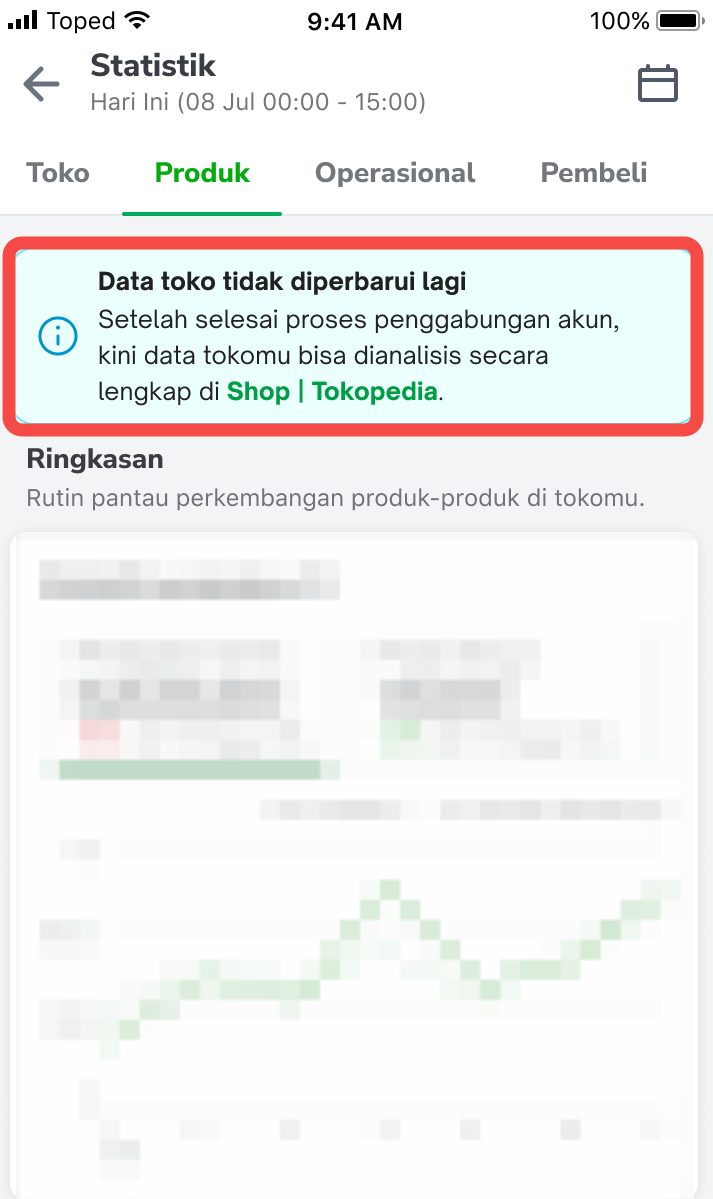 | Sellers will see this ticker displayed on all the following Wawasan pages (App), indicating that the data on Tokopedia is no longer updated:
|
- How can I view my shop performance data via ShopTokopedia on Desktop/PC?
You may also be interested in
- 1 lesson
Data Analytics
Utilize data analytics to track performance and make strategic decisions!
- 14 lessons
Product Tools & Partner
Discover essential tools and official TikTok Shop by Tokoepdia partners that help you streamline ope…
- 5 lessons
Data Compass
Introduction to data-driven decision-making tools for sellers to optimize their operations.
Financial Terms: Differences Between GMV & Settlement

Data Compass Overview
Summary This article teaches you about Data Compass Overview and the different modules available to…
Data Compass User Manual (PC)
Summary This article outlines all the different types of analytic pages accessible via Data Compass…

GMV Refinement for Clearer Customer Transactions

Shop Tab Analytics: Understand Your Data for Better Performa…
Shop Tab Analytics is an essential tool for gaining insight into your store’s performance and improv…