

How to check the data for creator?
05/17/2024
How to check the data for creator?
If you want to check the data from TikTok APP?
| Get into the TikTok shop,you will see the data overview of this account.The definition of this part:Revenue:Revenue from products sold via lite shop or from affiliateItems sold: The number of items sold from lite shop or affiliate (no items from third-part platforms) Customers:the number of customers that payed for goods from lite shop or affiliate, no repetitive counting if one customer made more than one purchase (no customers who made payment to third-part platforms) | 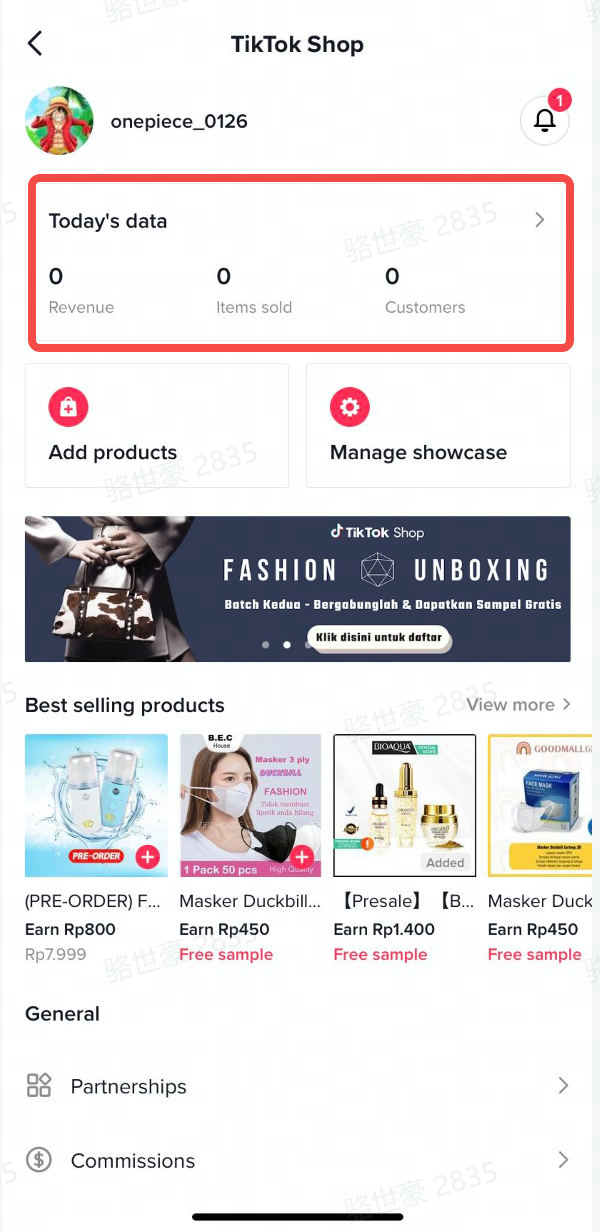 |
| If you click the【Today’s data】and get into the dashborad,you will see two parts: Overview&Top products sold today | 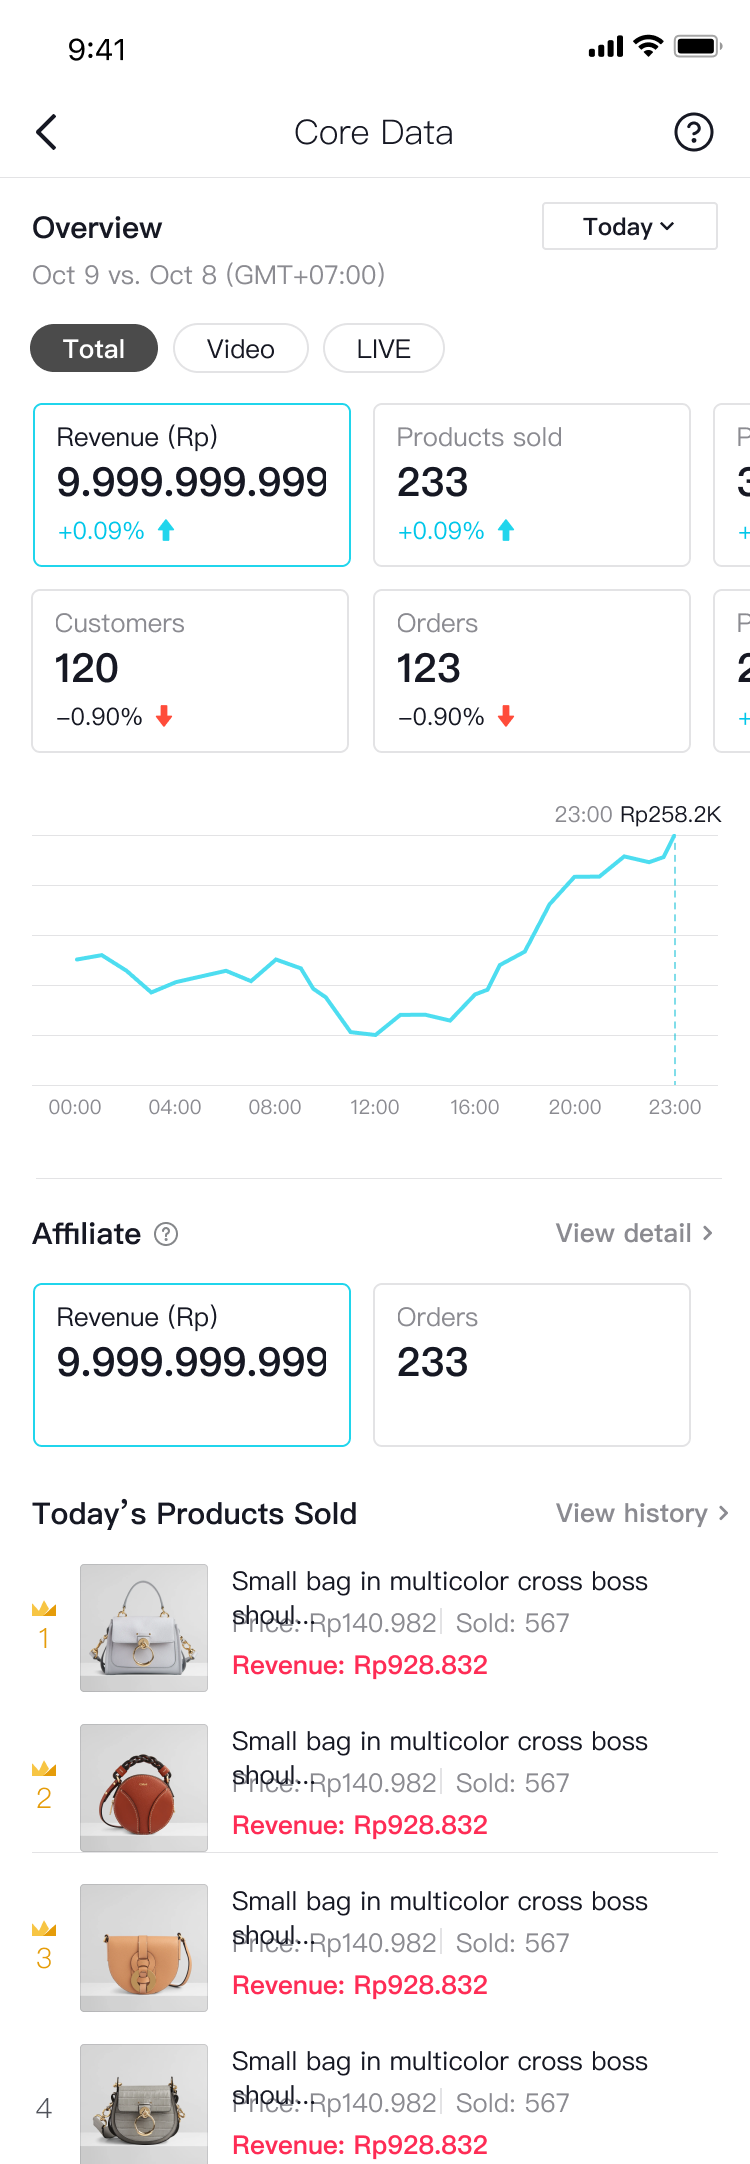 |
| For overview part,:You can filter the overview by only video/LIVE/date rangethe definition of six core index:Product views: the number of exposures that a product receives from short-videos, show window, lite shop and live-stream Revenue:Revenue from products sold via lite shop or from affiliateProduct reach: the number of clicks that a product is clicked from short-video, show window, lite shop and live-stream Orders: all orders placed at lite shop or from affiliate (no orders from third-party platforms) Customers: the number of customers that payed for goods from lite shop or affiliate, no repetitive counting if one customer made more than one purchase (no customers who made payment to third-part platforms) Items sold: the number of items sold from lite shop or affiliate (no items from third-part platforms) | 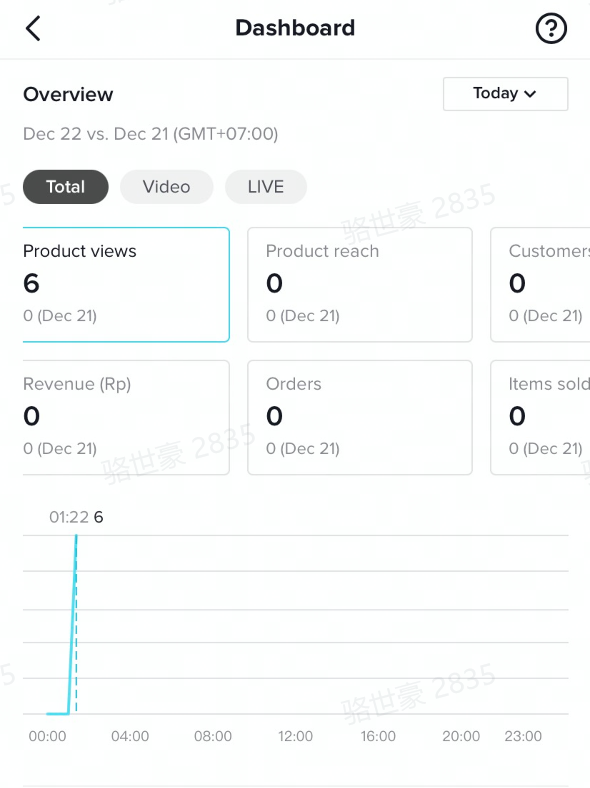 |
| trend chart:Selecting one index, it will show the trend chart below. If you select the date range as 'today' or 'yesterday', for the X axis,set 1 point every 1 hour If you select the date range as 'last 7days','last 28days', for the X axis, the trend shows the past 7/28 days | 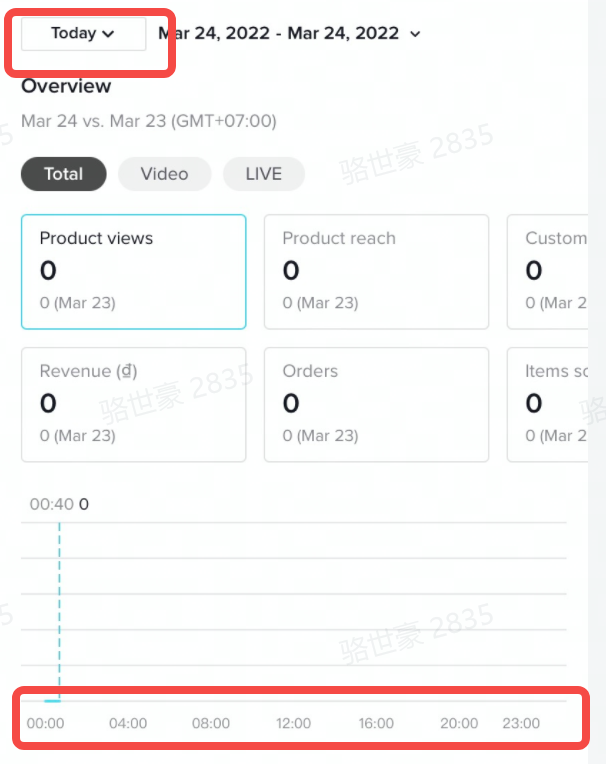 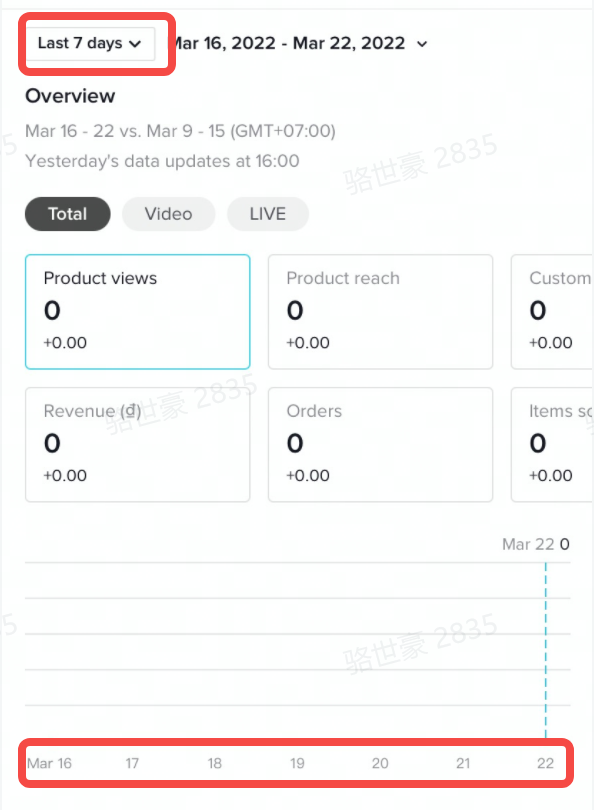 |
| comparison:It shows comparison in the second row of each indicator.For example: if you filter yesterday 's data, the comparison will be:yesterday's data- the day before yesterday's data. | 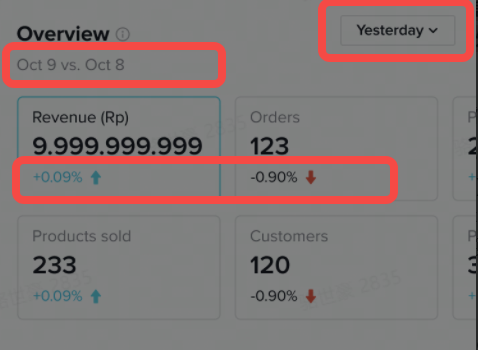 |
| For Affiliate Order:In this area, it will show revenue and order indicators of affiliate orders.Revenue:Revenue from products sold affiliate.Orders: all orders placed affiliate (no orders from third-party platforms) .If you want to check details of affiliate order, you can click 【view detail】 and jump to affiliate order page to know more information about affiliate data. | 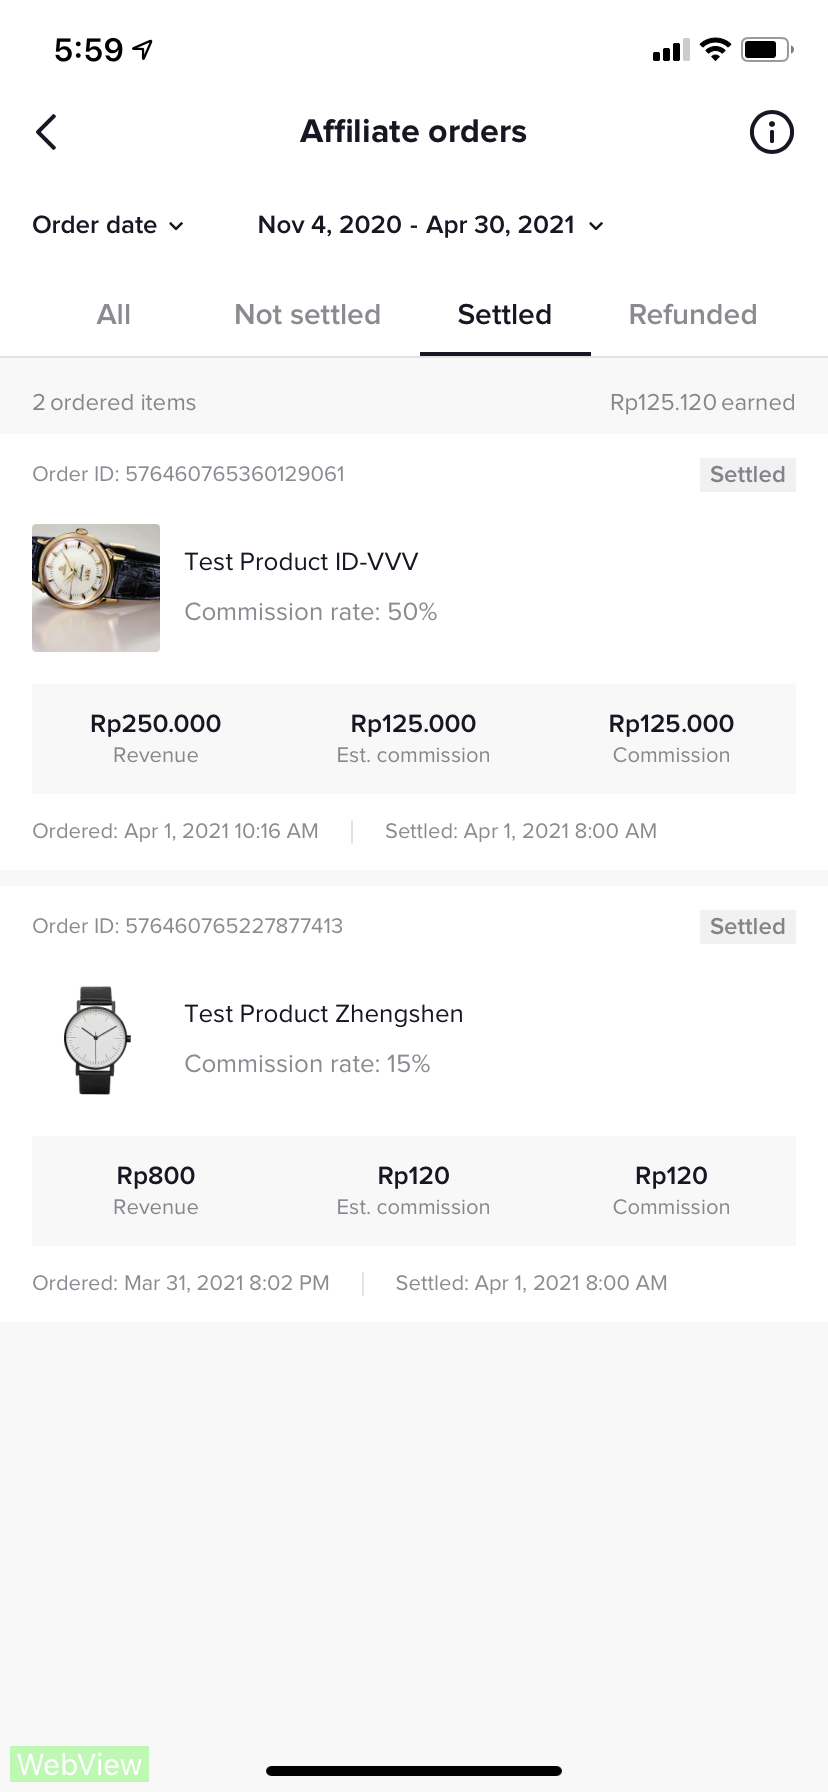 |
| For top products sold today: In this area, it will show the number of products sold (with buyers making payments) today.The rank of the list is according to daily sales volumeIt shows the the product image, product name, unit average price, daily item sold, daily transaction volume. | 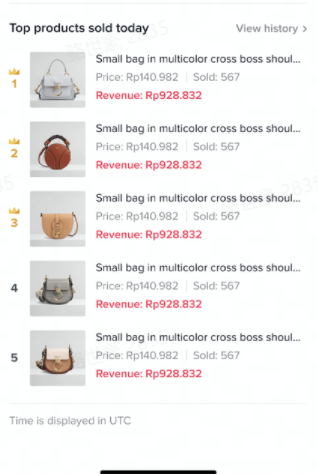 |
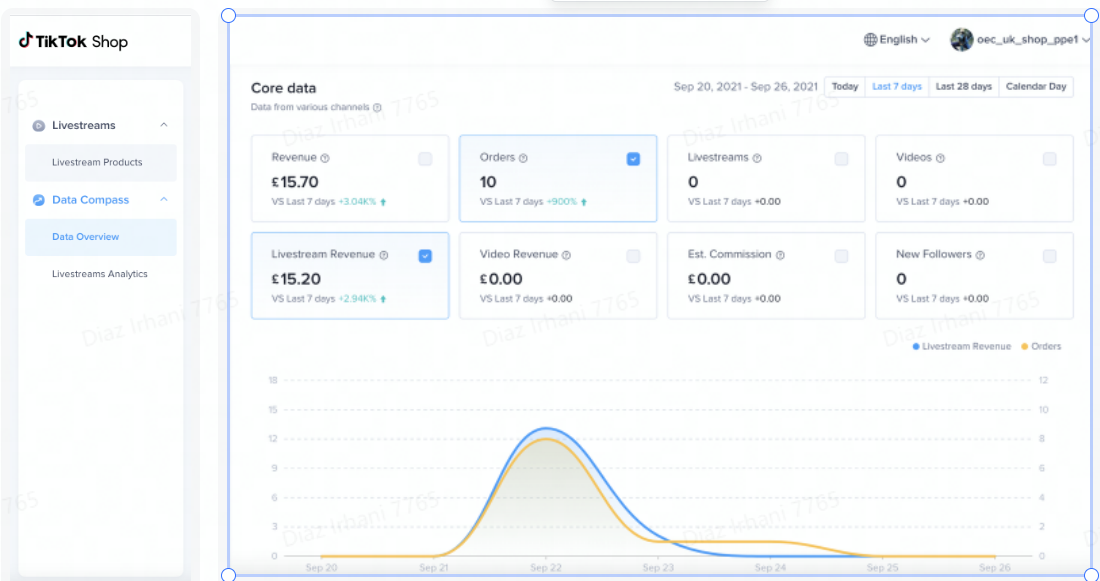
3.1.1 Core Data Supports Time period selection for corresponding data. Supports 2 metrics for comparison and Correlation analysis. ( includes WoW data comparison)Data Overview:supports Hosts performance overview, including new followers, income etc.
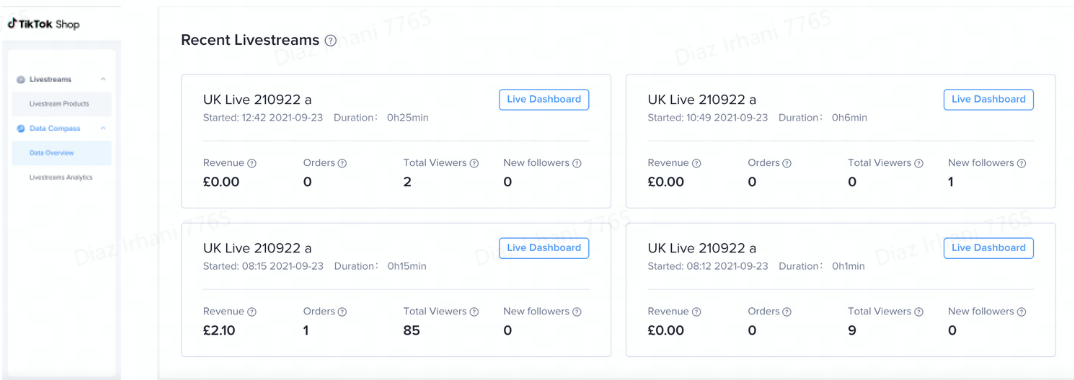
 3.1.1 Recent Lives
 - Displays 4 recent EC livestreams and corresponding data(Revenue, Orders, Total Viewers, New followers)
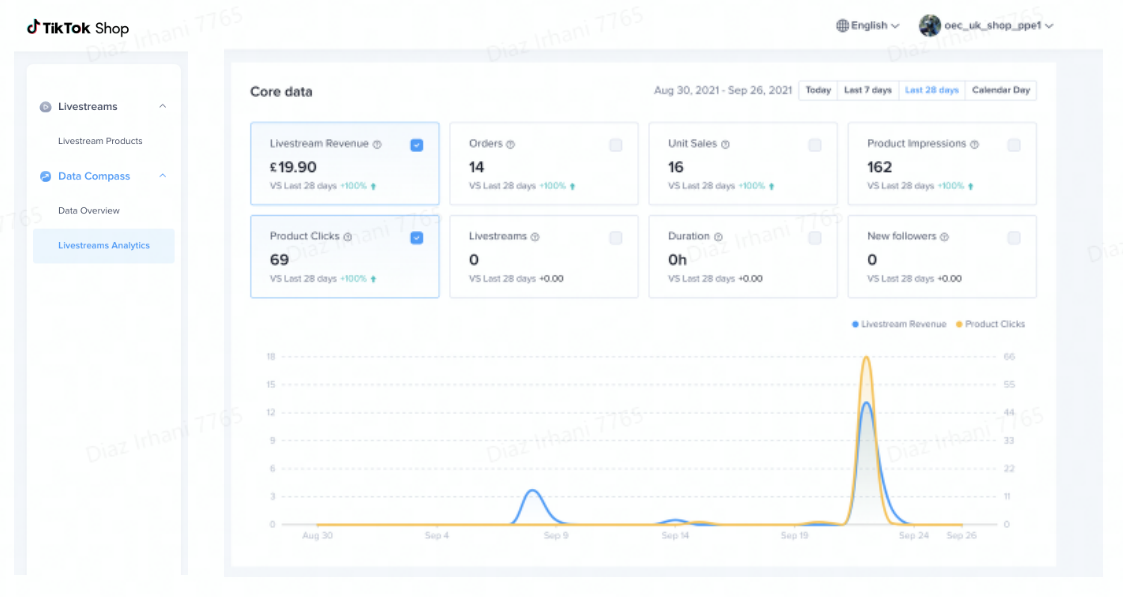
 3.2Live Analytics
 3.2.1 Core Data - LiveLivestream Detail Page:Livestream data in details and supports export supports hosts with LIvestream Reviews.
Supports Time period selection for corresponding data. Supports 2 metrics for comparison and Correlation analysis. ( includes WoW data comparison)Includes Livestream Core data
 3.2.2 Livestreams Details
 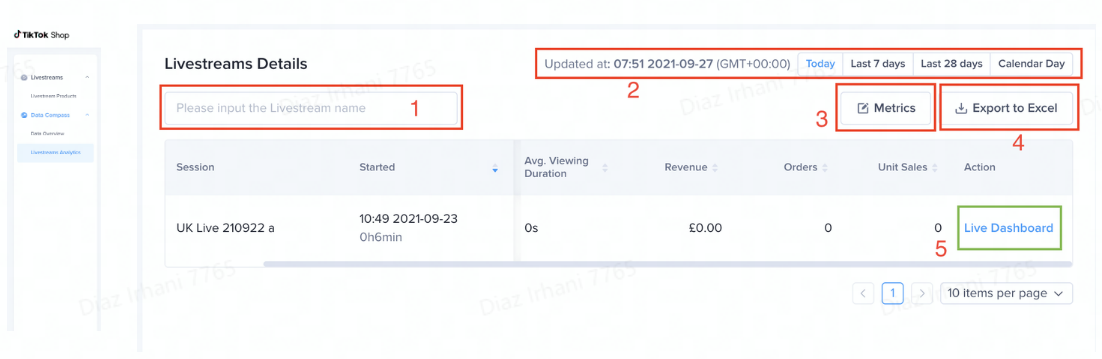 Supports Livestream name searchTime period selection for corresponding data Metrics:Catagorized into "traffic metrics" and deal metrics, with a maximum of 5 indicators. Supports data exports to excel Click Live Dashboard to enter the "Live Dashboard" for a more live details regarding a single livestream. 3.3 Live Dashboard for Streamers
3.3.1 Live Dashboard EntranceLive Dashboard:Provides Real-time Live data and livestream playback, which supports Hosts to Modify their Livestream strategy in real time and enable hosts to Review their Livestream afterwards.
| How to enter the Live Dashboard | Demo |
| Data Overview => Recent Lives => Live Dashboard | 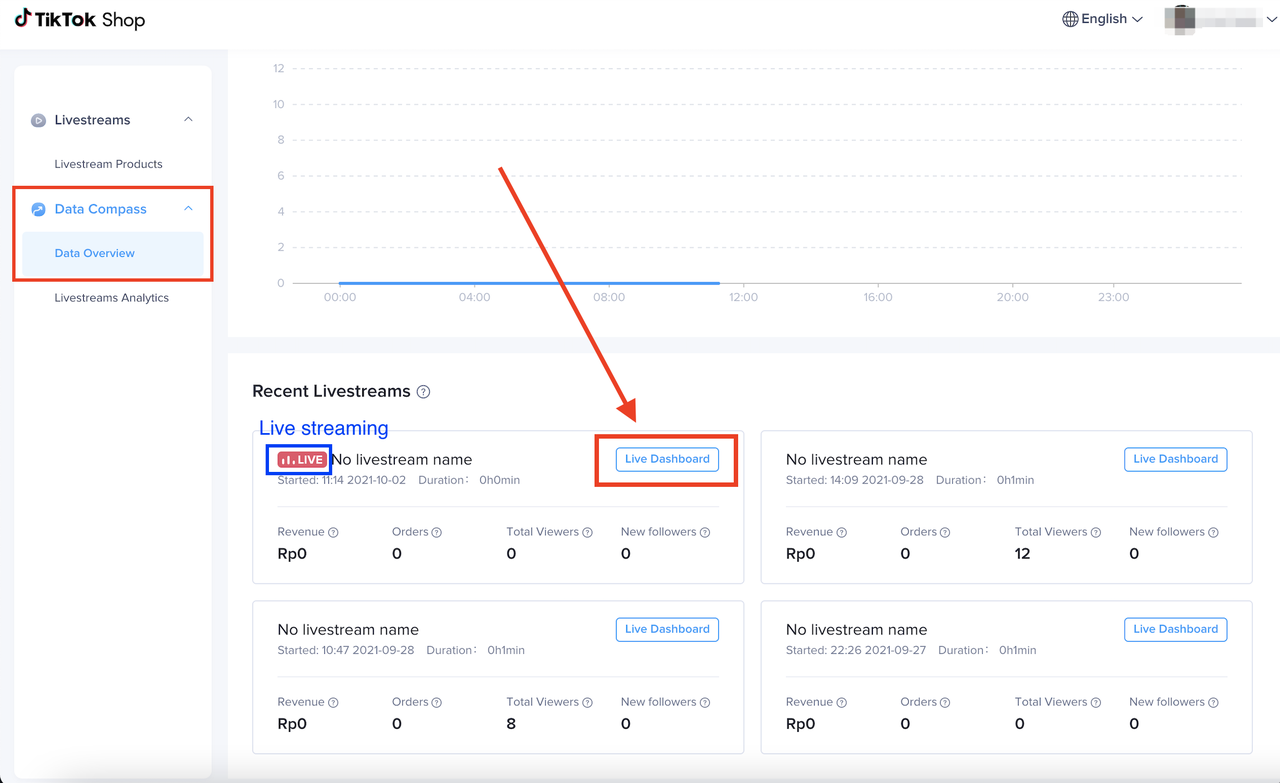 |
| Live Details => Livestream Details => Live Dashboard | 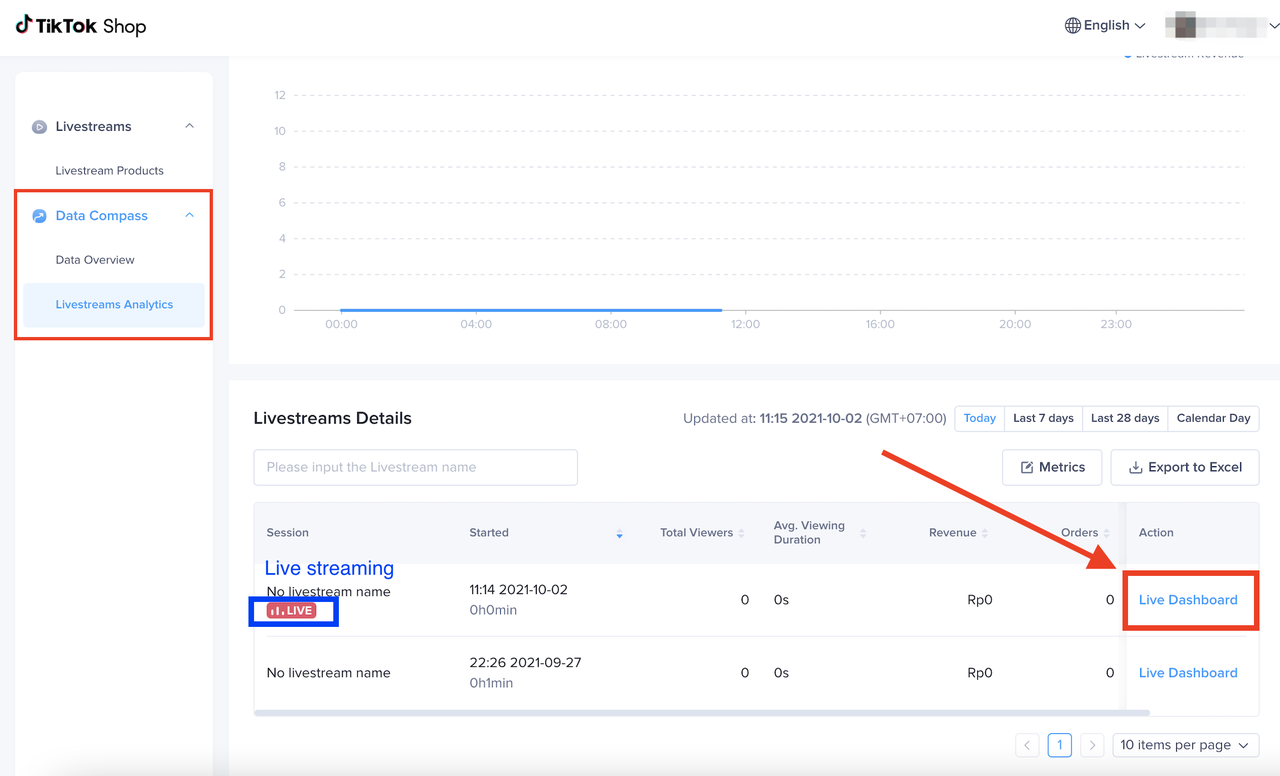 |
| Function module | Feature | Demo | Instruction |
Core data | LIVE basic info | 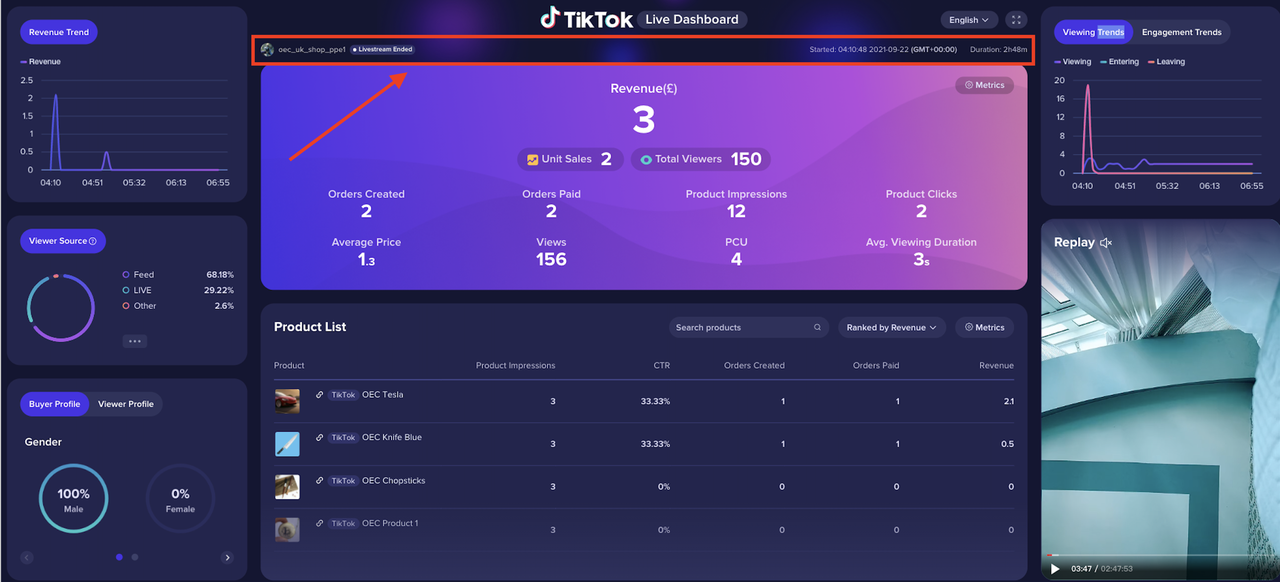 | Show the handle, the start time of LIVE, and the duration of the LIVE |
| Core indicator | 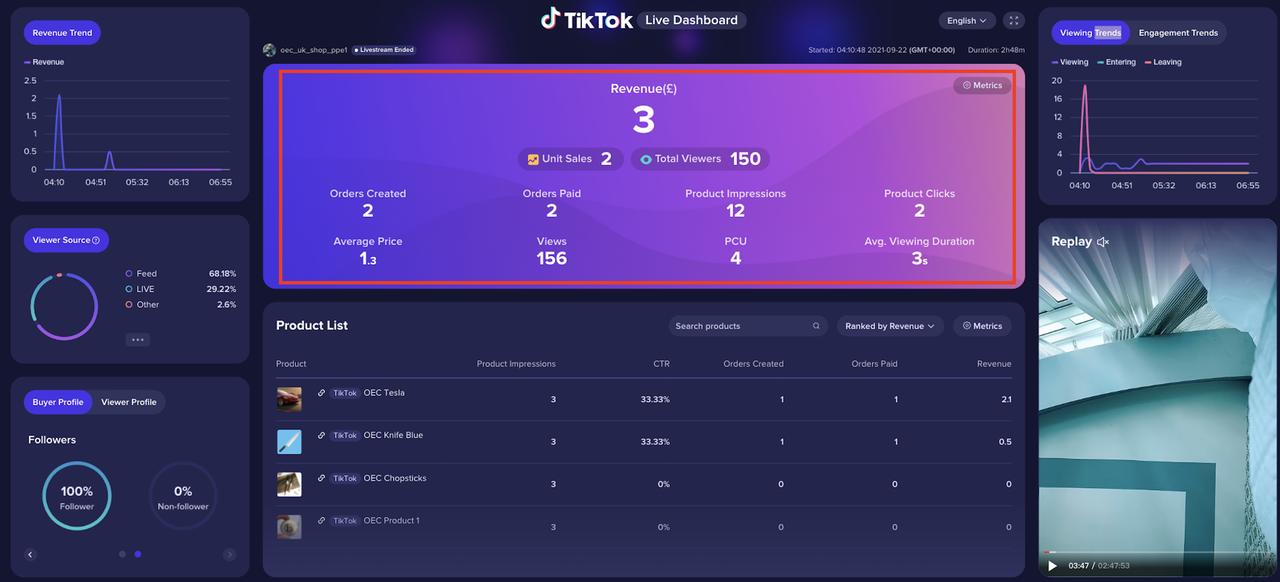 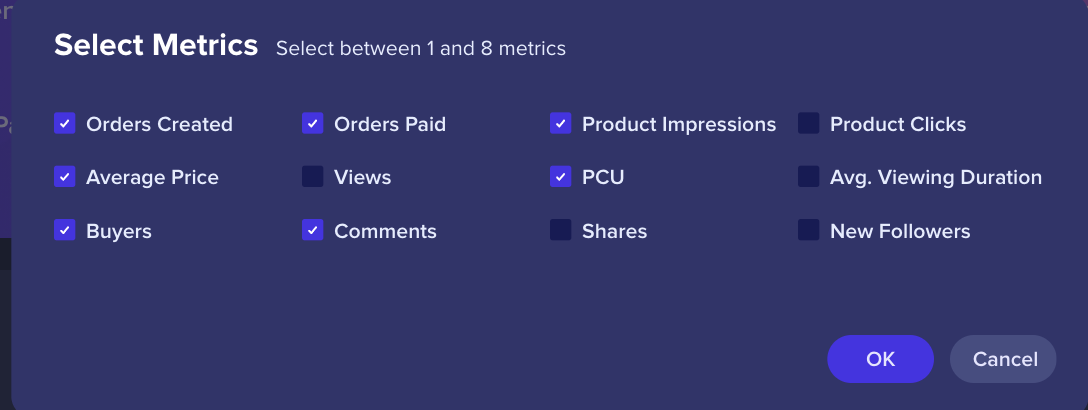 | Indicators can be manually configuredClick 'Set indicator' button to configure indicators in the pop-up window | |
Product list | Product info | 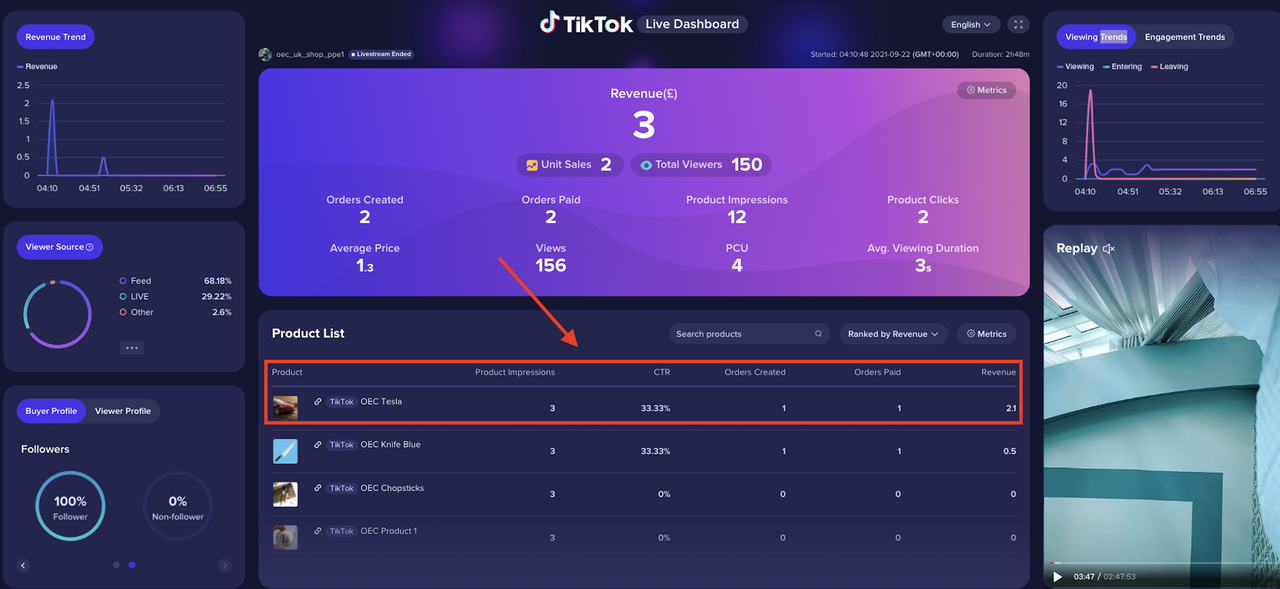 | Show all the products in this livestream, including on-platform products and off-platform products, display the source label of products |
| Indicator Sorting | 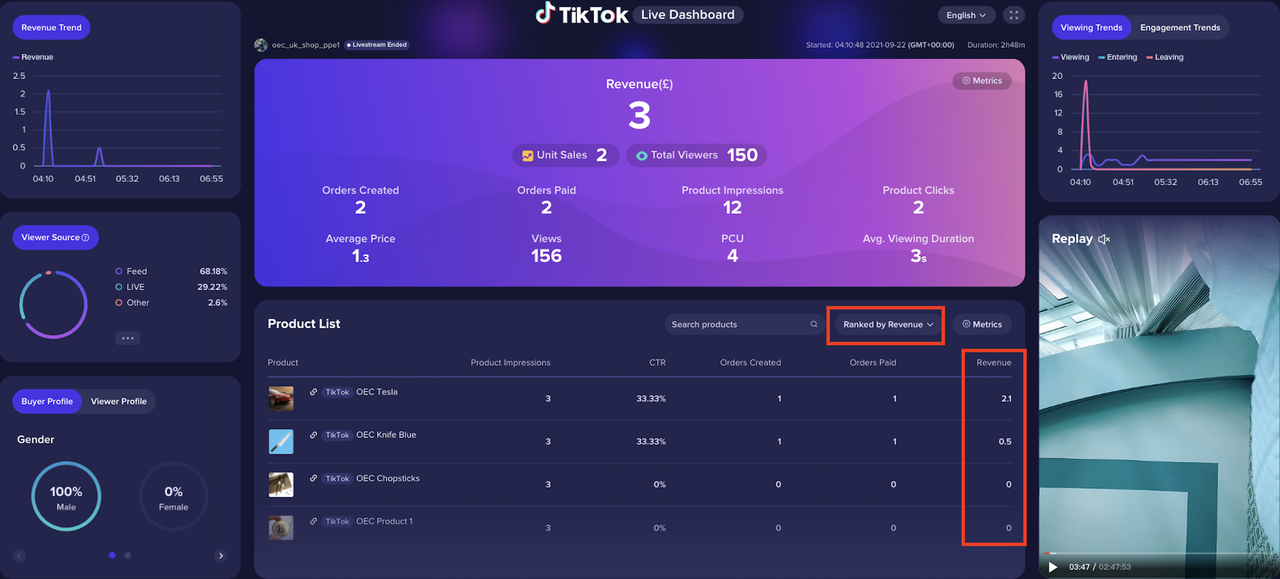 | The user sorts the product list (in descending order) according to the selected indicator | |
| Set indicator |  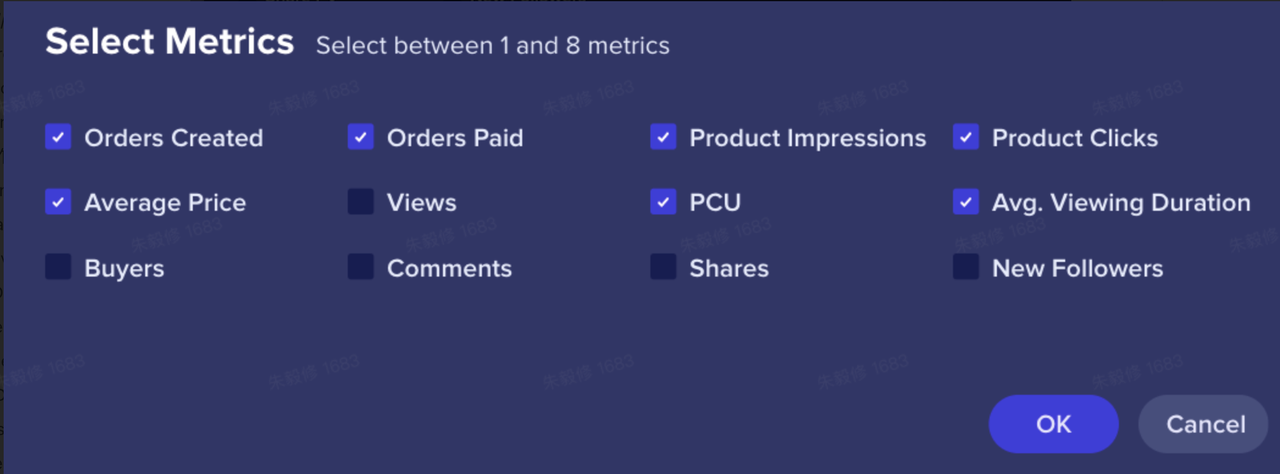 | Click 'Set indicator' button to configure more indicators, select up to 5 items, select at least 1 item | |
| Fuzzy search | 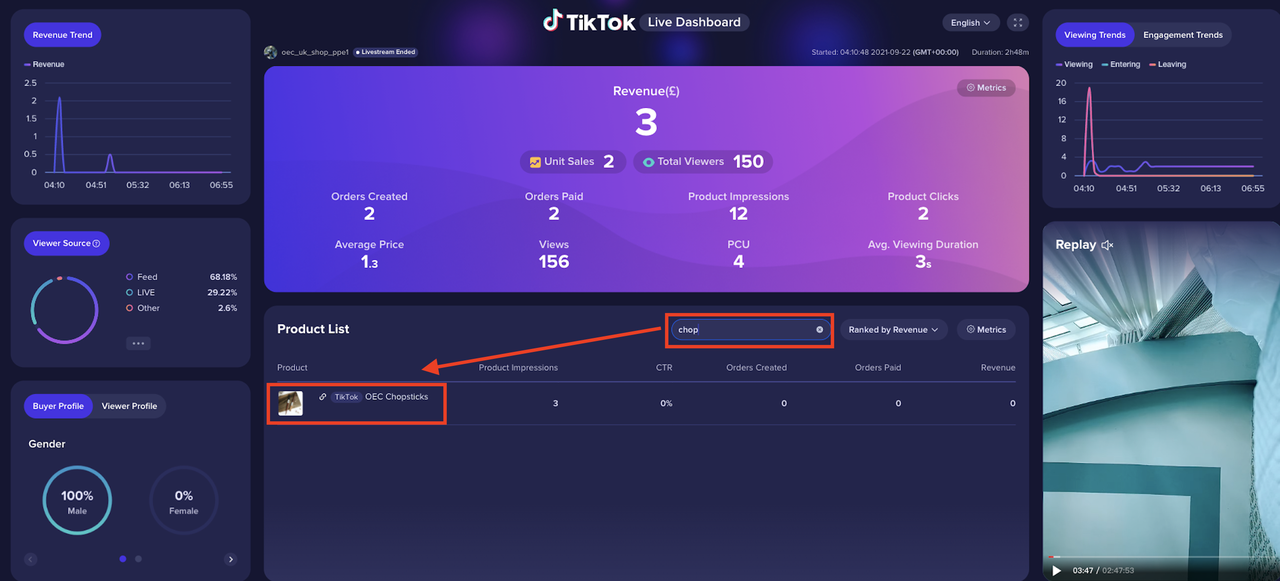 | Fuzzy search can be performed according to the product name | |
| Revenue trend | Revenue trend | 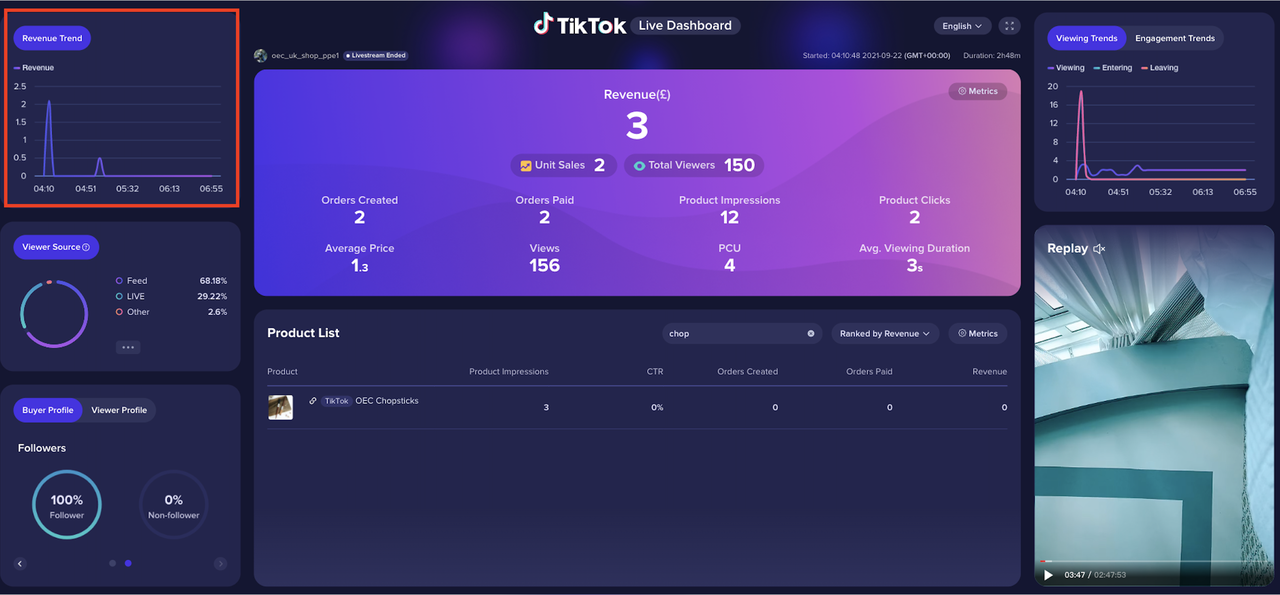 | Provides minute-level trends for Revenue |
| Traffiic source | Traffic source | 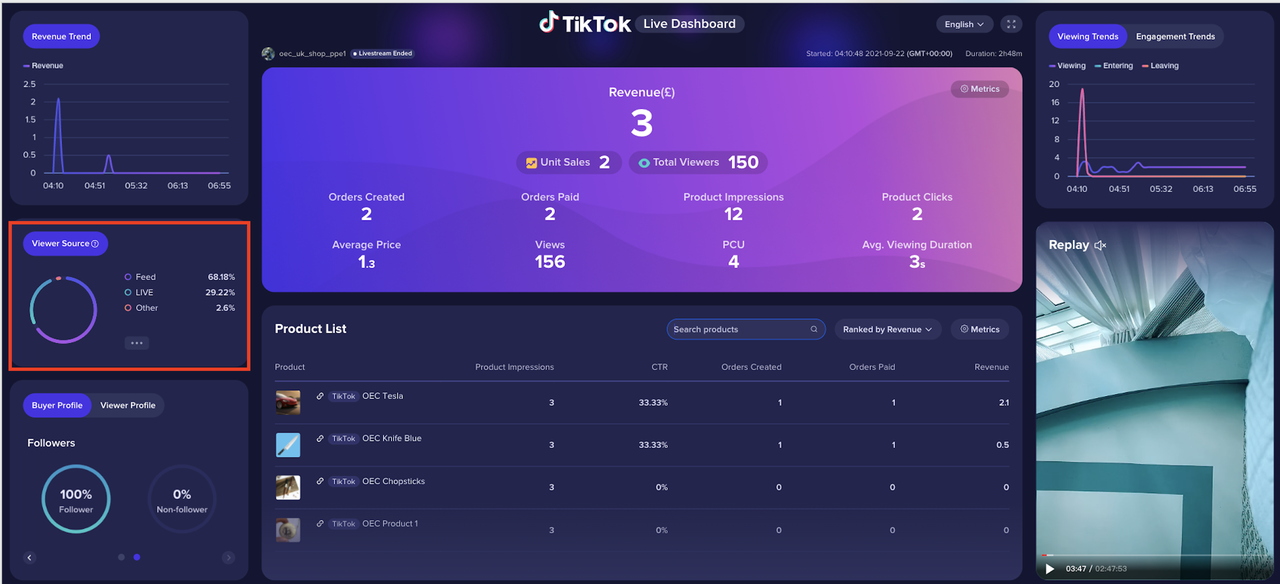 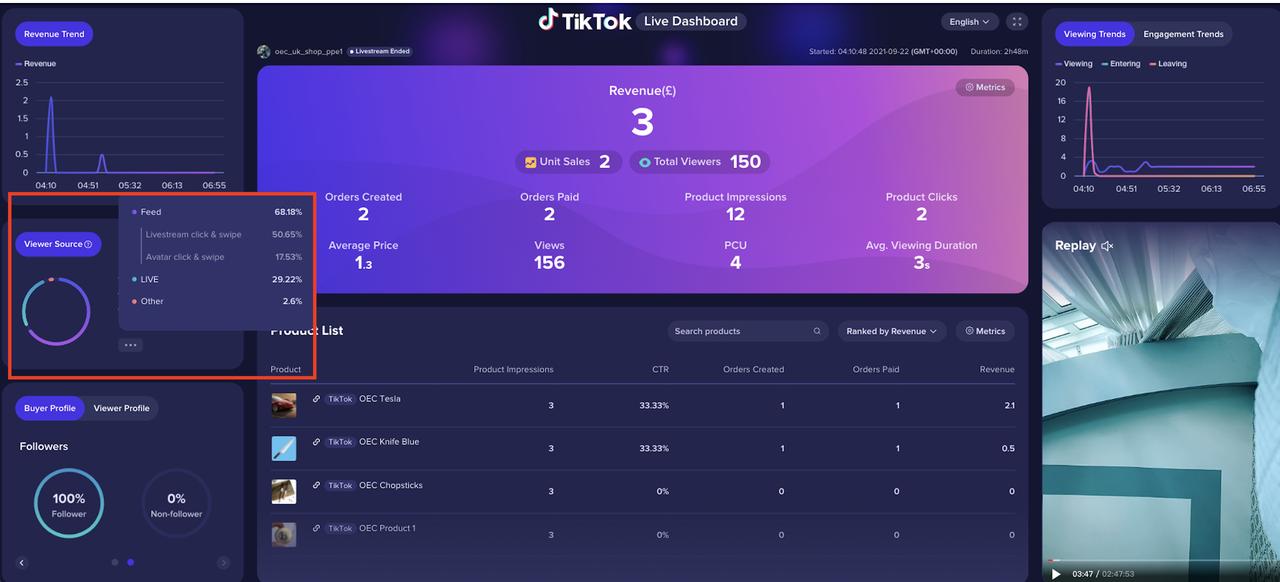 | Currently, we only support organic traffic sources details. For paid traffic, we classify them in the 'others' channel for now. |
User profile | Buyer profile |  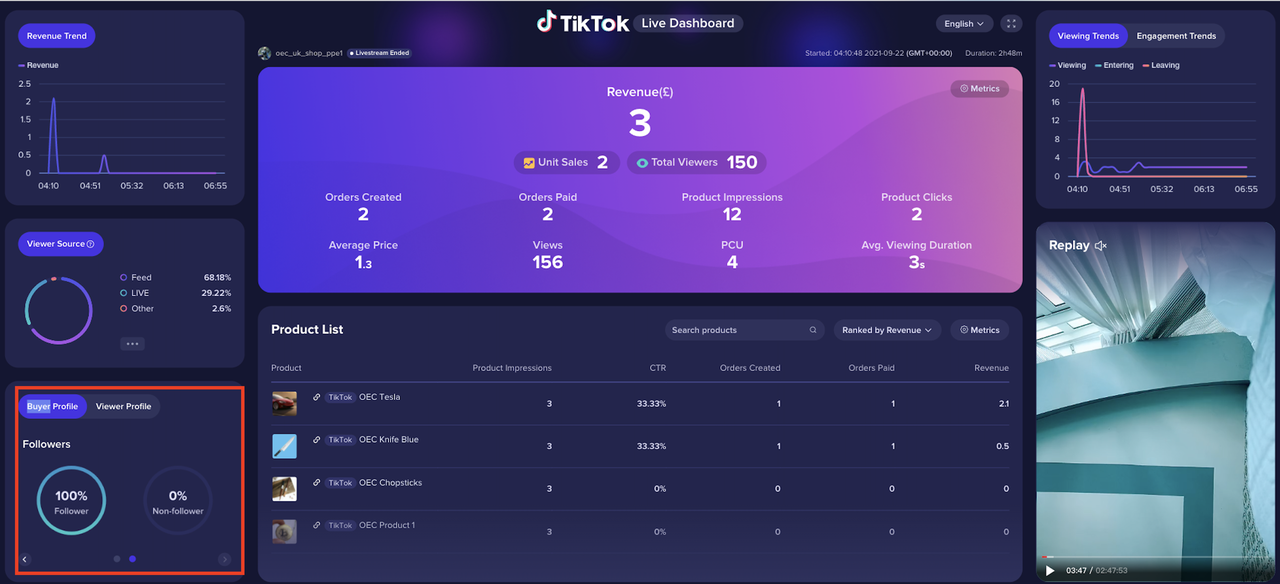 | Include 1) whether Buyers are fans or not 2) Gender |
| Viewer profile | 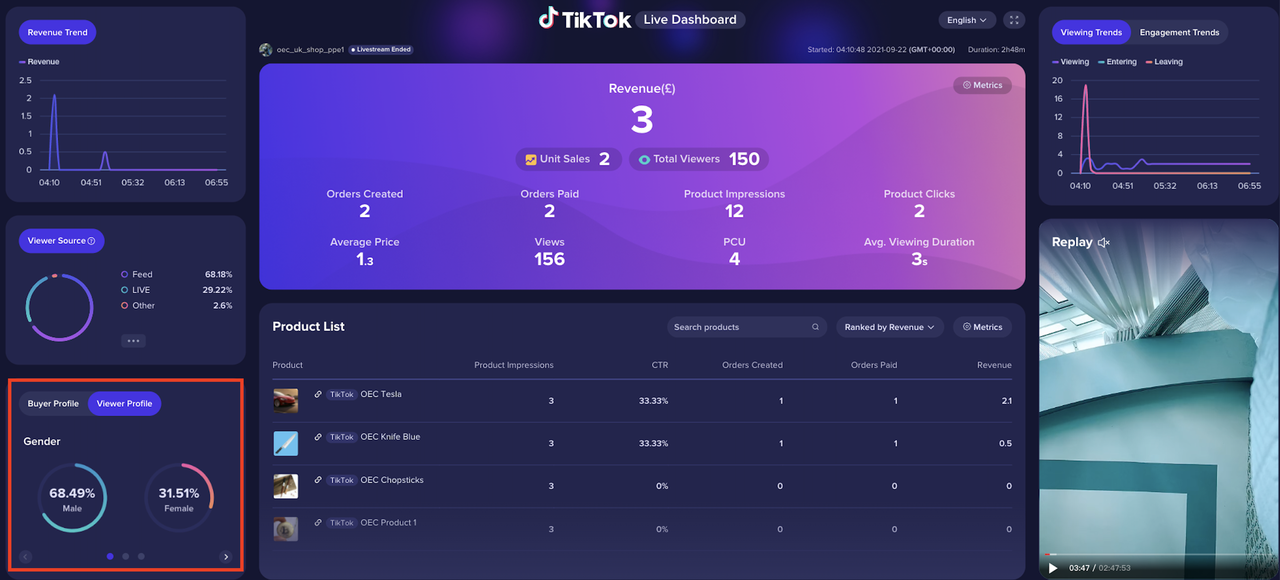 | Include 1) whether Viewers are fans or not 2) Gender 3) Viewer Country proportion | |
Interactive trend | Viewing Trends | 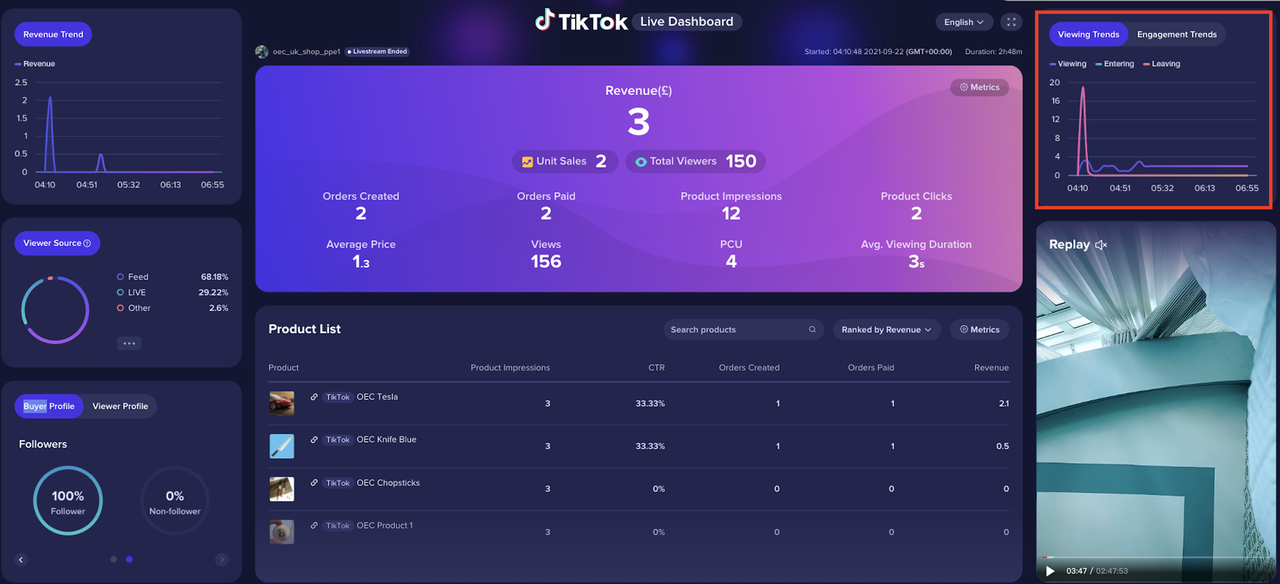 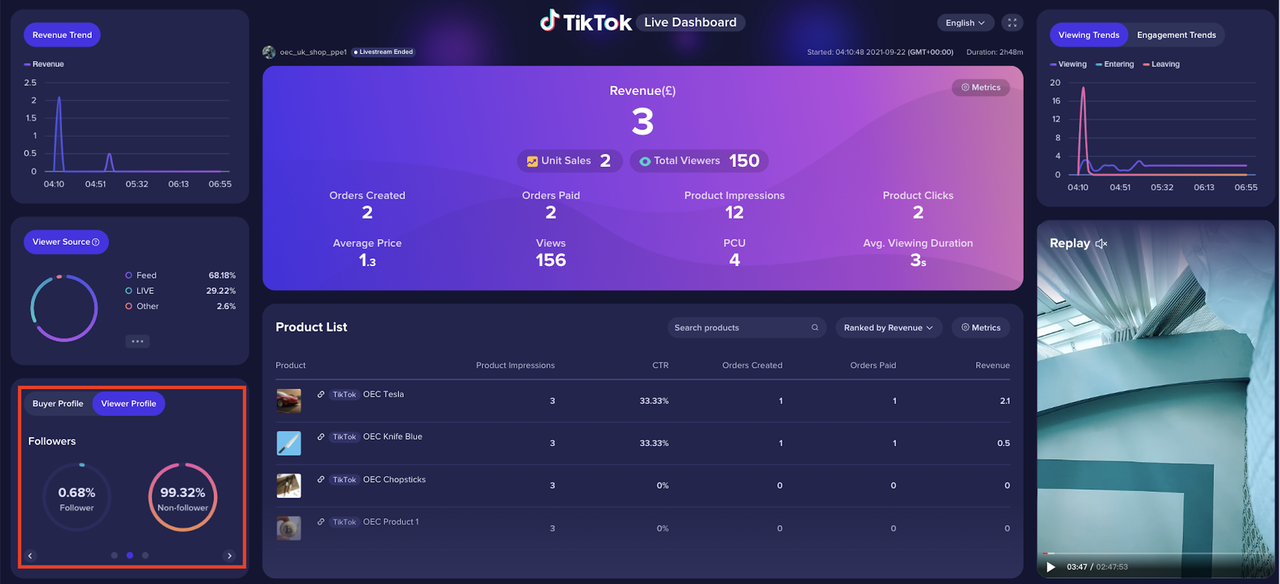 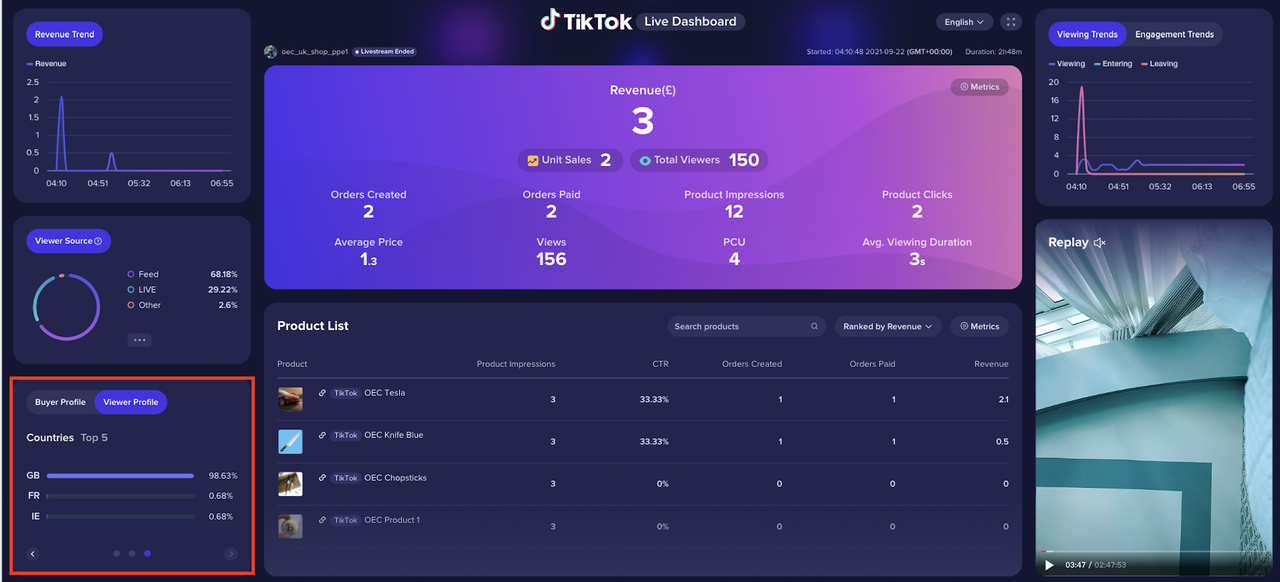 | Provide minute-level trends for Livestream Viewing, Entering, and Leaving |
| Engagement Trends | 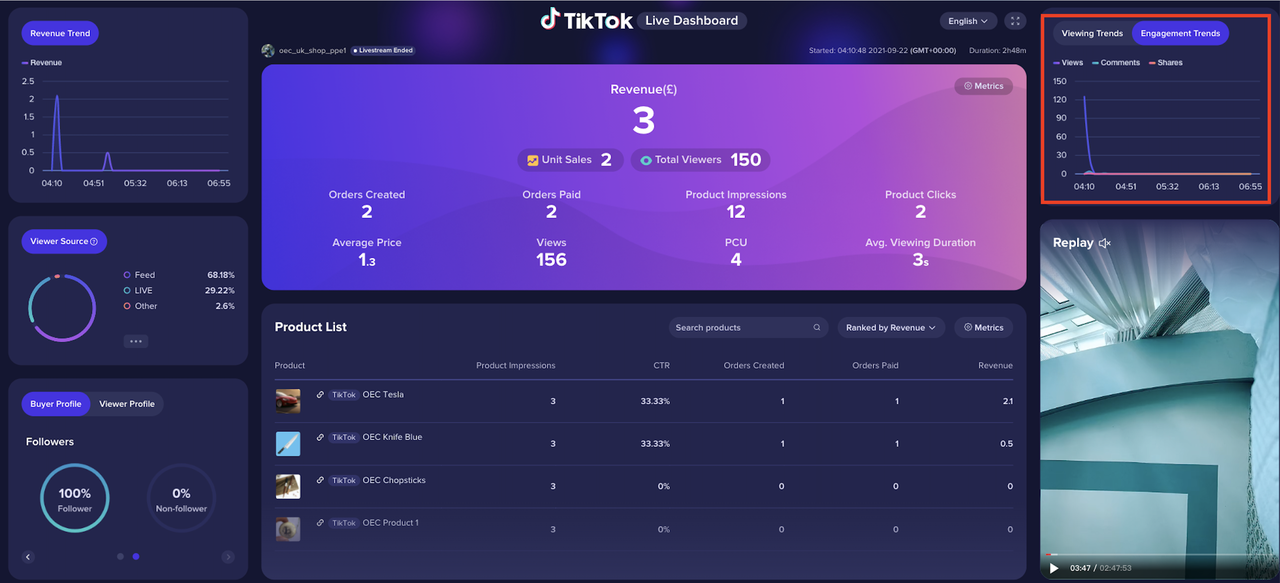 | Provide minute-level trends for Livestream Views, Comments, and Shares | |
| LIVE | Real-time LIVELIVE replay | 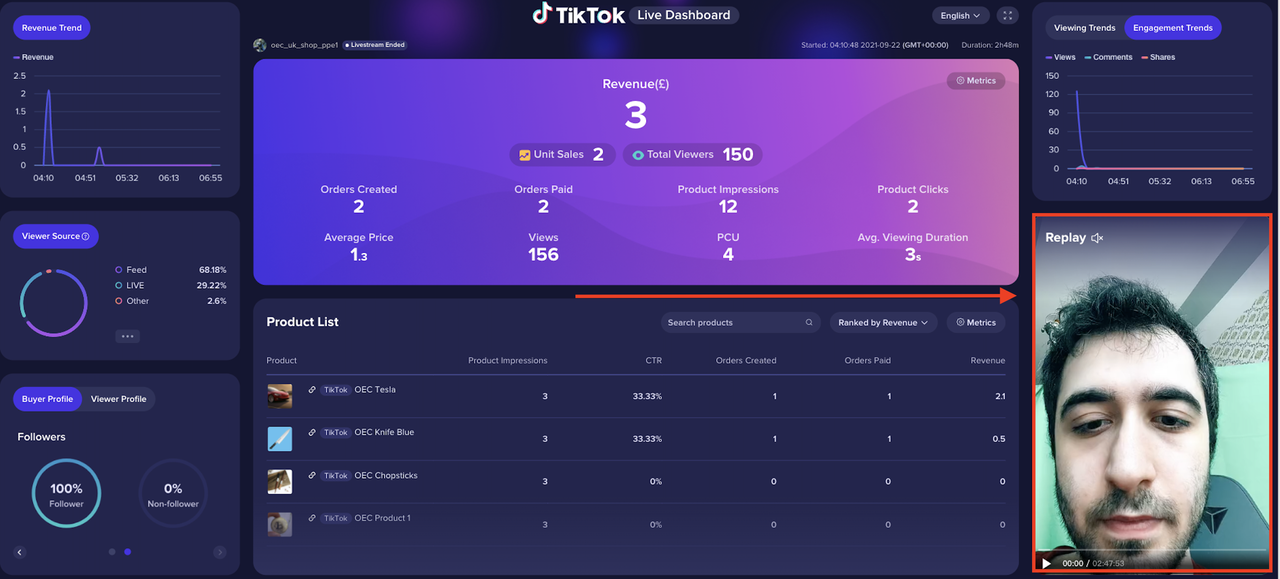 |
|
| Other funciton | Full screen |  |