

Analyze Short Video Performance Using Data Compass
12/29/2024
Hi Seller!
Creating short videos is only half the job. To make your videos truly drive traffic and conversion, you need to analyze how they perform. This guide shows you how to use the Data Compass tool to review, improve, and optimize your short video performance on TikTok Shop by Tokopedia.
Let’s learn how to turn data into smarter content strategies!

By analyzing performance data in Data Compass, you can:


Creating short videos is only half the job. To make your videos truly drive traffic and conversion, you need to analyze how they perform. This guide shows you how to use the Data Compass tool to review, improve, and optimize your short video performance on TikTok Shop by Tokopedia.
Let’s learn how to turn data into smarter content strategies!
Why You Should Analyze Your Short Video Performance
Short videos are not just for views—they’re a key driver for product discovery, clicks, and sales. But not every video performs equally. Some drive lots of engagement but low conversions, while others quietly bring in orders with minimal interaction.By analyzing performance data in Data Compass, you can:
- Spot top-performing content that brings actual sales
- Understand your audience behavior: where they drop off, what they click
- Optimize future videos by learning what works (and what doesn’t)
Step-by-Step Short Video Analysis Using Data Compass
Step | What to Learn | Where to Check |
| Get a high-level summary: total videos uploaded, view performance, interaction count, CTR, and conversion rate. | 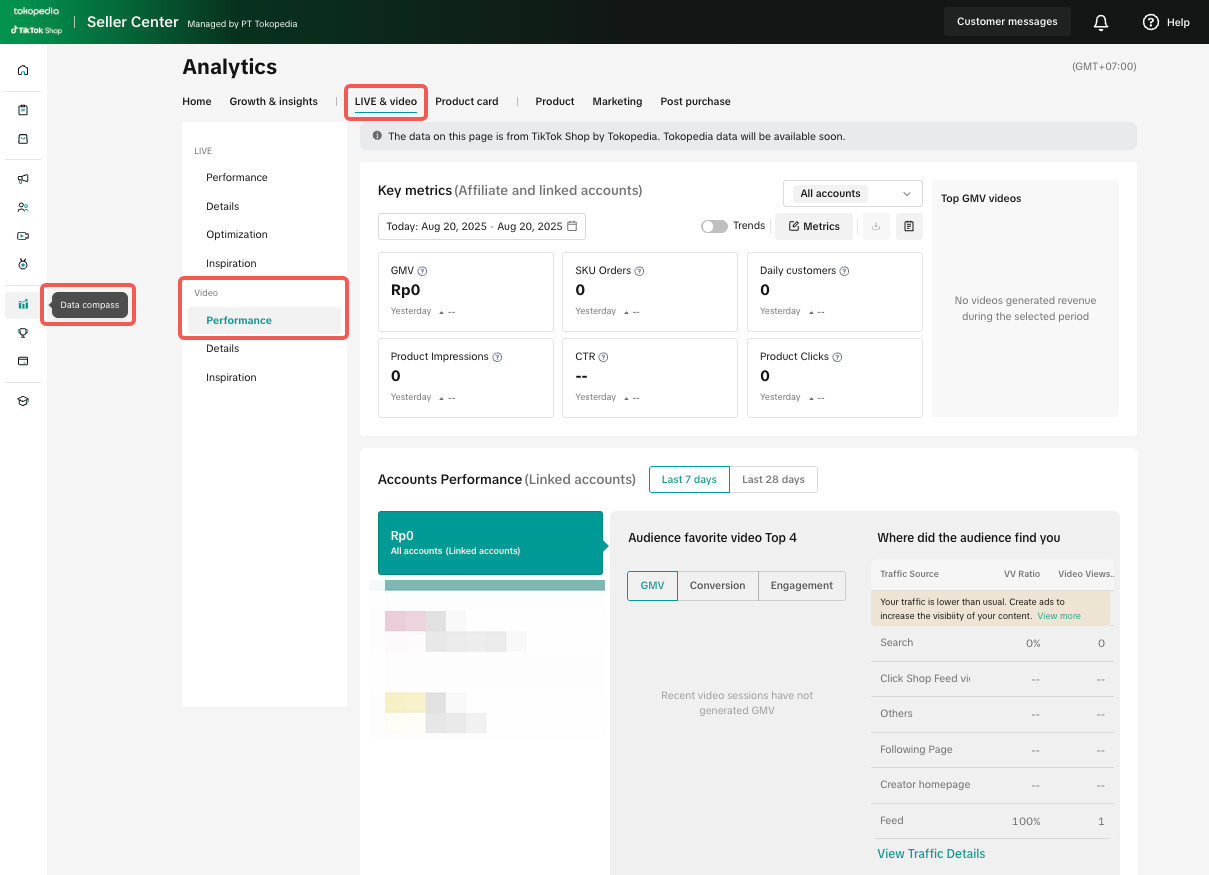 |
| Understand which creators are generating the best results—compare CVR, CTR, VV, and orders. | 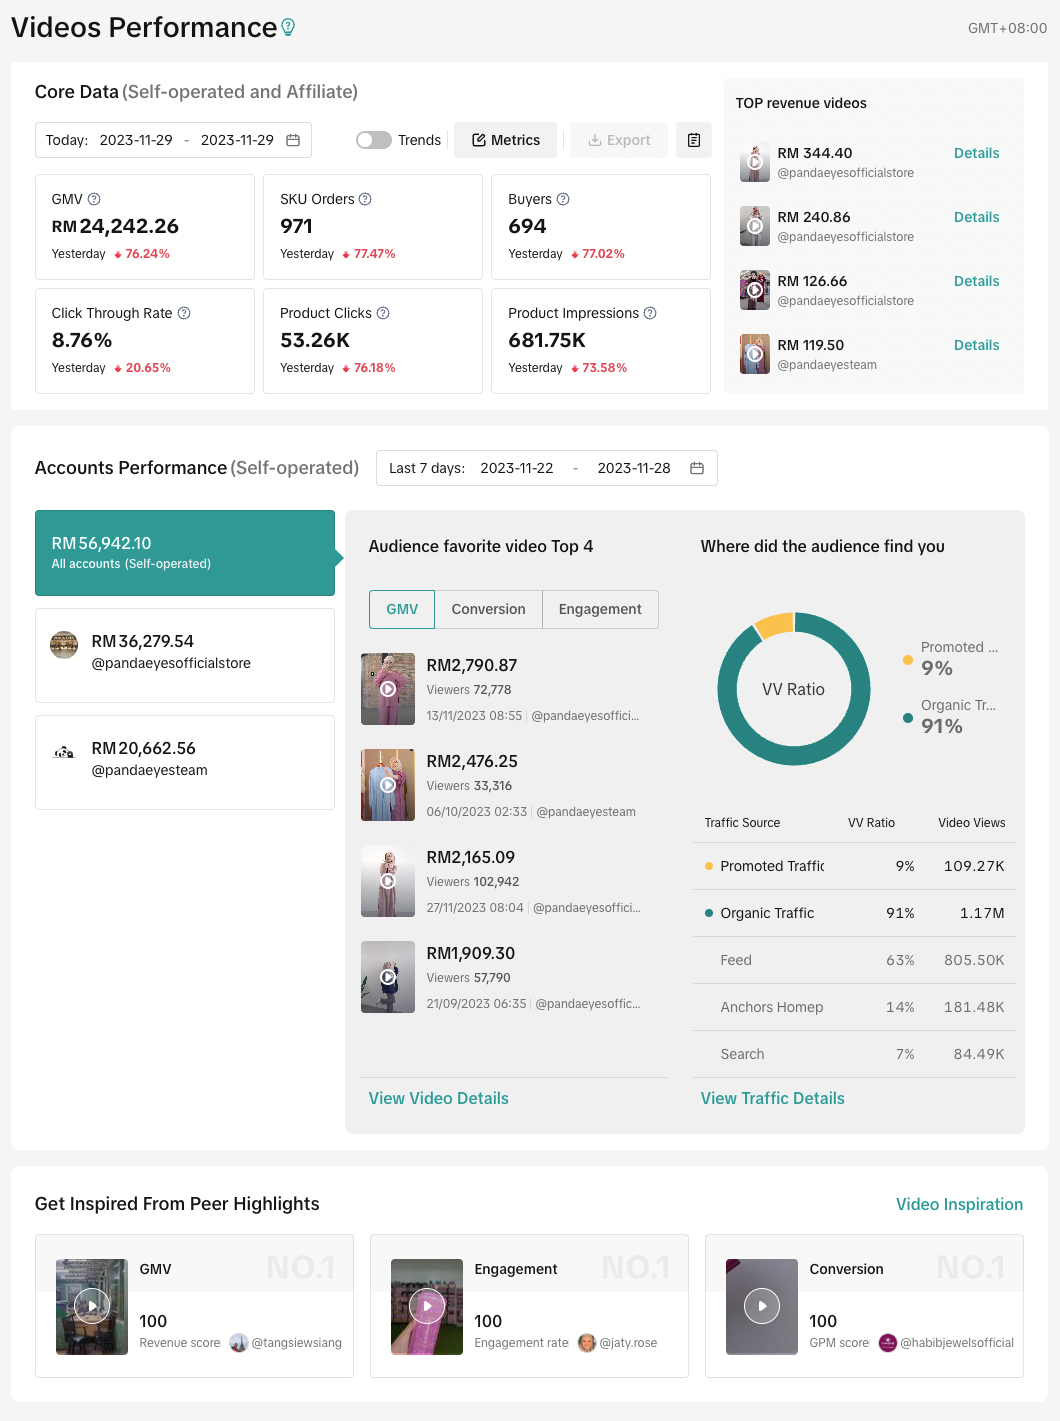 |
| Review performance trend over time and audience behavior (views, click, conversion). | 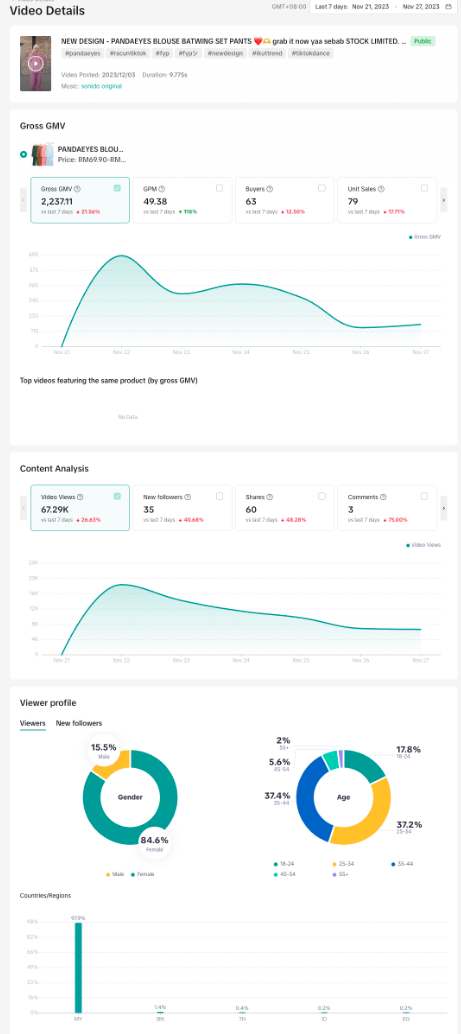 |
| Spot drop-off points and improve future scripting or visuals to keep viewers engaged. | |
| Make smarter, data-informed decisions for your next short video uploads. |
The 6 Most Important Metrics to Watch
These 6 key metrics help you measure and improve your short video’s impact:Metric | What It Means | Why It Matters |
| 1. GMV (Gross Merchandise Value) | Total order value from your videos. | Directly shows how your videos drive sales. |
| 2. CTR (Click-Through Rate) | % of viewers who clicked after watching. | Reveals how effective your video is at persuading action. |
| 3. SKU Orders | Number of unique products sold via video. | Helps identify which products are in demand. |
| 4. Add to Cart | How many users added the product to cart. | Signals buying intent, even if they didn’t check out. |
| 5. Buyers | Number of users who completed a purchase. | Indicates how well your video attracts real customers. |
| 6. Product Impressions | Number of times your product appeared in video. | More impressions = more chances to convert. |
Use These Questions to Guide Your Analysis
- Which video has the highest conversion rate?
- Which creator generated the most orders?
- Are videos with high completion rate also bringing in more clicks?
- What topic or title works best for my audience?
Anda mungkin juga tertarik
- 5 lessons
Data Compass
Introduction to data-driven decision-making tools for sellers to optimize their operations.

Performa LIVE
This article teaches you how to use LIVE Performance. Specifically, it will show you how to view you…

Video Diagnosis
This article will show you how to use the Video Diagnosis feature to create more engaging content as…

Video Performance
This article teaches you how to use Video Performance. Specifically, it will show you how to view yo…